Ratio Analysis - the last resistance point still standing?
By James Bartelloni
July 2, 2025
Ratio analysis needs to be in every chartists toolkit. Believe it or not, the PATTERNS work great w/ them, especially on the longer term charts. On my weekly show (sorry no show this weekend w/ 4th of July) I have been discussing this ratio every week. For me, it's literally my ejection seat.
You see, back in the day, I was able to rack up over 1500+ hours flying in the coolest jet alive - F14 A/B/D Tomcat. What a blast and what a ride. What does this have to do w/ investing? EVERYTHING - for me. You see, even though I've got hundreds of landings on an aircraft carrier both day and night, attended TOPGUN and became a Naval Aviation Strike Fighter Tactics Instructor (SFTI - still a pinnacle of my life) - I was the dude who never flew the jet. Therefore, ultimately, did I control all of the risk? Nope. (Technically, I did, as I could pull the ejection handle anytime but that is an "other" in the good/other world - leave it at that) So, no, I did not have the stick and throttles so that made me even MORE diligent in understanding my craft, the jet, the surroundings and, essentially, driven to prove that you (us back seaters) could master a high performance fighter to the best of your ability even though you didn't have the stick and throttles.
Guess what, that is why I have been studying the understanding of the PATTERNS and why they work. For me, and certainly hope not for you, I wanted to understand why the market stopped at a number for a reason. I believe (for me) that I understand this very well. Good, all that does is help me manage risk. It was the same thing in the jet ... I knew everything about the weapons systems and the enemies tactics. Why? To manage risk ...
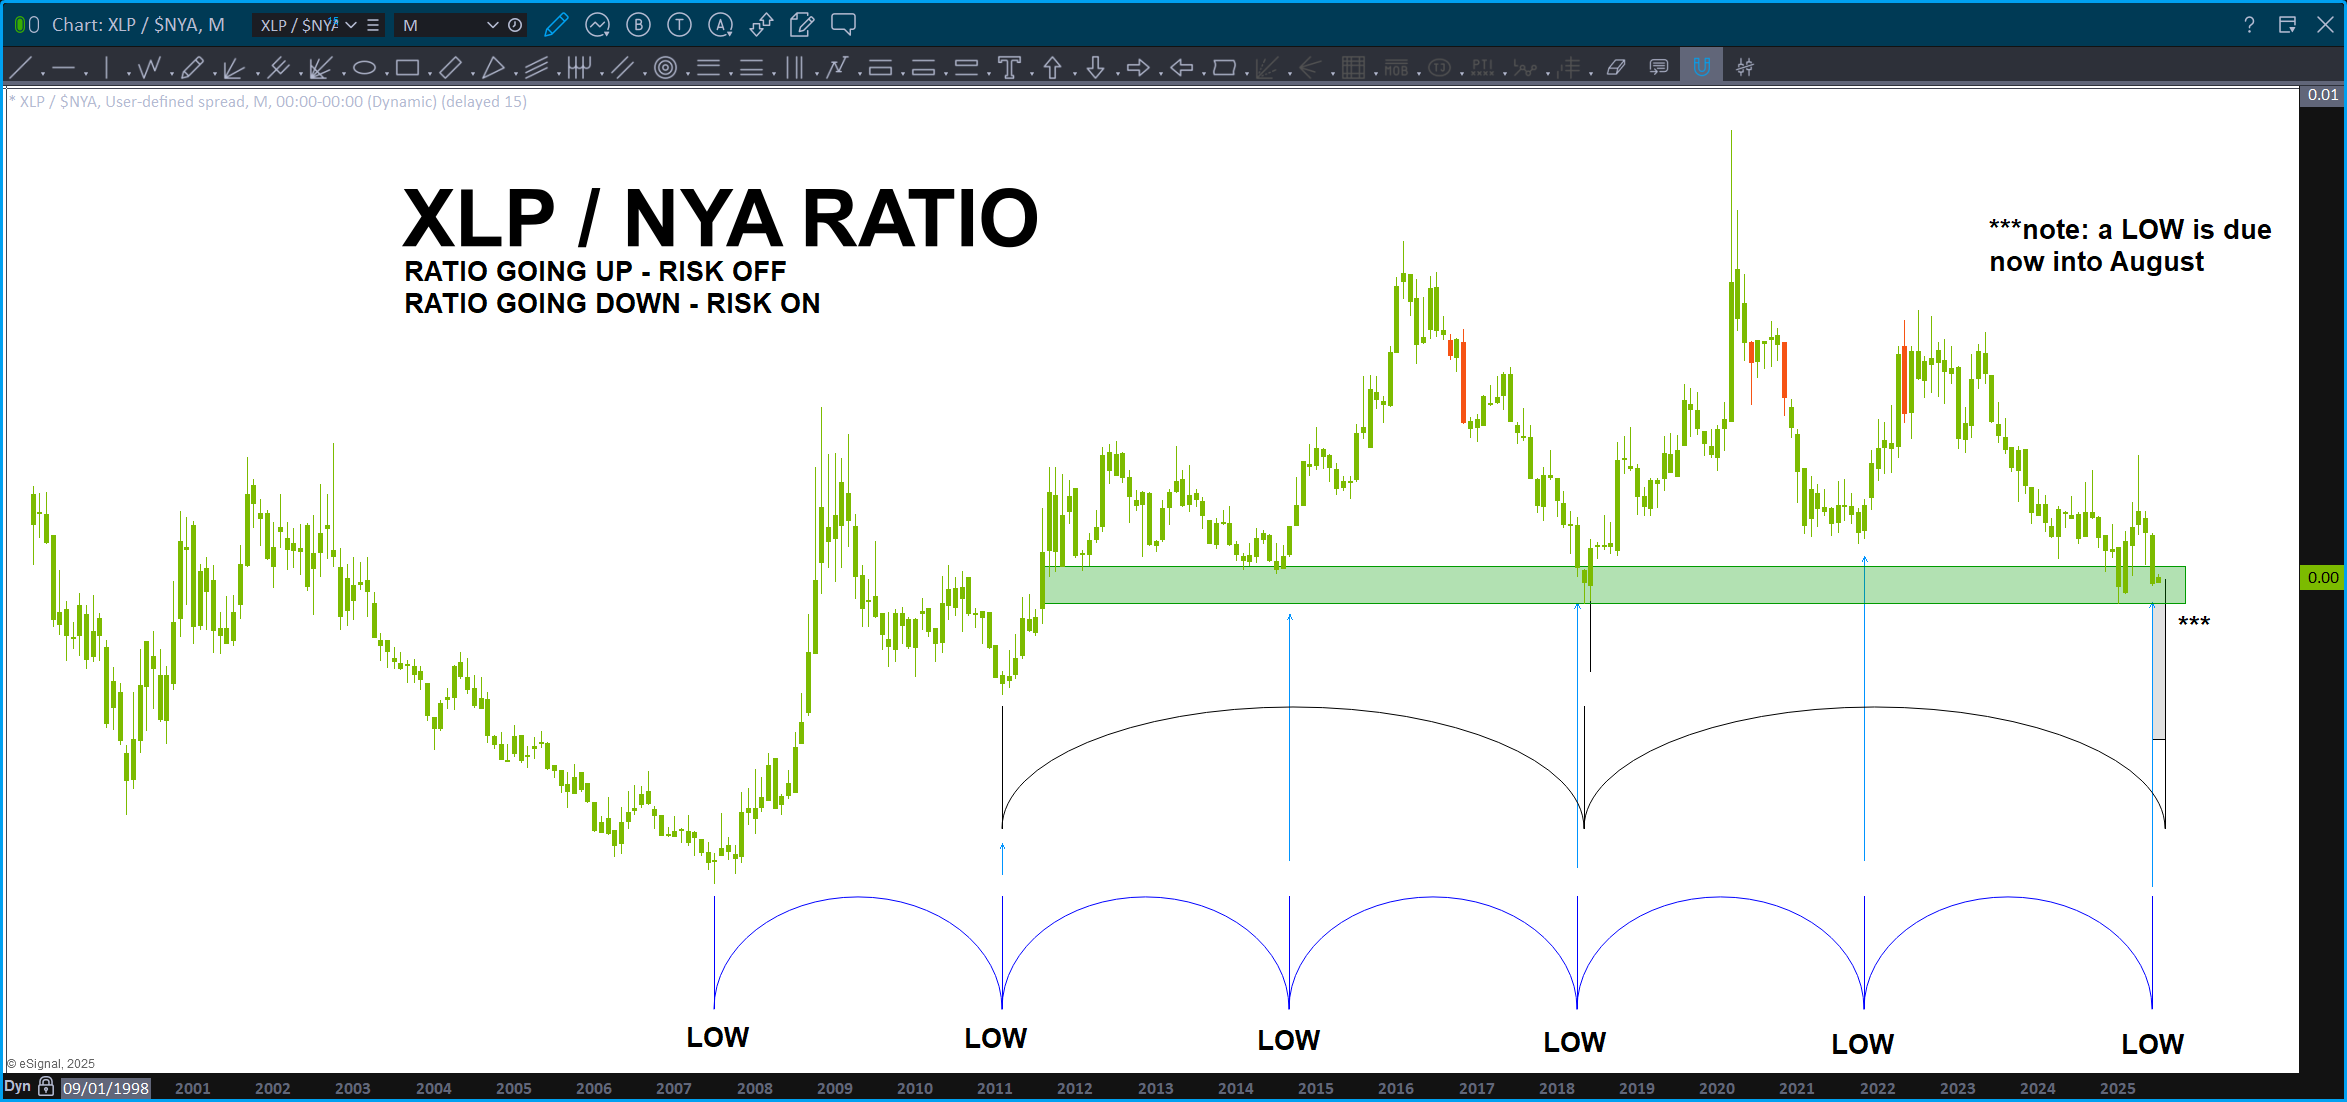
So ... to get long this equity market, I simply want to see a FIRM weekly close below that support. I've been watching it for a long time. Yes, if you were listening to me on the radio show, I actually called the level for the low with the caveat to not get married to it and expect a bounce ... did I know that would be the low for the V bottom and a potential low like 2007. Absolutely 100% NOPE. Of course not ... but I can also tell you I did NOT see such a large bounce/move coming in equities. Again, I'm just a pattern dude.
Right now, I see that 'dual time cycle' hitting now into August. (Note, this puppy could keep going till August 31 as it's the month of August). That time cycle has called every low in the ratio for the past 18 years. I'm not sure if I want to play with that record right now w/ everything going on right now ...
I'd be tightening stops, conservative and getting ready to understand we have entered a very crucial time period for equities. That's all I'm saying. Let's get thru this time zone and see if the BUY pattern below the 10+ year support zone fails, before really lighting the burners and taking this puppy higher.
That could happen ... but, I could have also been fish food after every launch off the pointy end. This was my buddy Pig: https://youtu.be/bChxhn-EpGk?feature=shared . Manage risk.
I'm going to be chilling looking for some waves to set up as I do believe there is going to be an awesome LONG or SHORT that will be a lot easier to take ... I have no idea what is going on out there, so at least I have my patterns. :)