
Take a Look at This SE Chart

Due to Monday’s holiday there are no insider filings to report today. We’ll be back tomorrow with a look at that activity.

In the interim, Sea Ltd $SE has been on our radar ever since Rep. Kurt Schrader reported a position in a political filing back in 2022.

When the guys returned from Asia last year, we started stalking it even more closely. While it had an exciting growth story, more importantly, it had no evidence of a bottom. 

The stock was free-falling in a 90% drawdown back then.

So, we've been waiting patiently for a perfect pitch for some time now. 

We need to see clear signs of a trend reversal before we follow insiders into their trades. While our hot corner data is great, the chart always comes first.

And after several years, we finally think this chart is ready for us.

When we first traded it in March of this year, we got in at $56 with a target at the base breakout level of 90. However,  back then, we said we’d like it a lot more in the 90s.

Fast-forward to today and SE is already to and through our target. 

This rounding bottom pattern is officially complete, and the path of least resistance has shifted higher:

Prices have also broken above the VWAP from all-time highs, meaning buyers are in full control across all timeframes for the first time in nearly three years.

Now that the primary trend is up, we're looking to continue riding this international stock market leader.

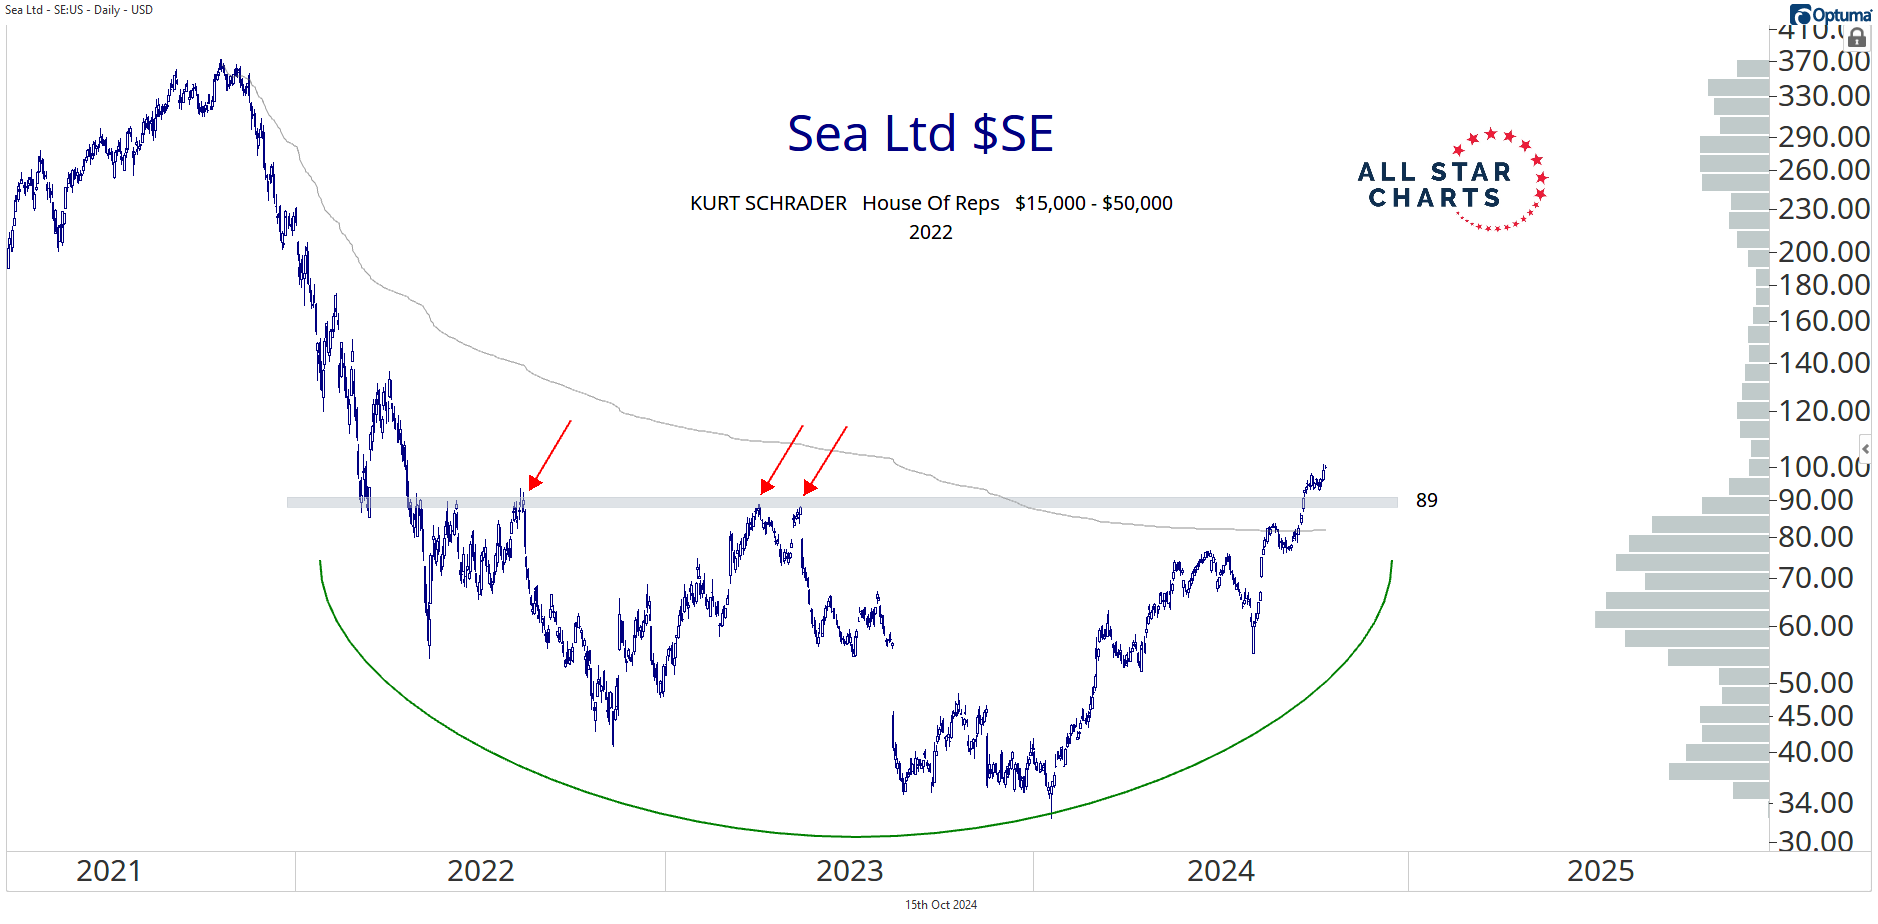
We’re long above 89 with a target of 161 over the next 3-6 months.

And if you want to add some leverage to this beautiful base breakout, click this link and sign up for Breakout Multiplier. We just put an options trade on SE also.

That’s just how much we like it.

Stay tuned. We'll be back on Wednesday with more insider activity.

And please reach out with any questions. We love hearing from you!

For questions about your membership, contact us at 323-421-7910 or info@stockmarketmedia.com

Filed Under: