Big Up Days and Big Down Days Are Neck and Neck ⚖️
By Grant Hawkridge
December 4, 2025
Today's number is... 1%
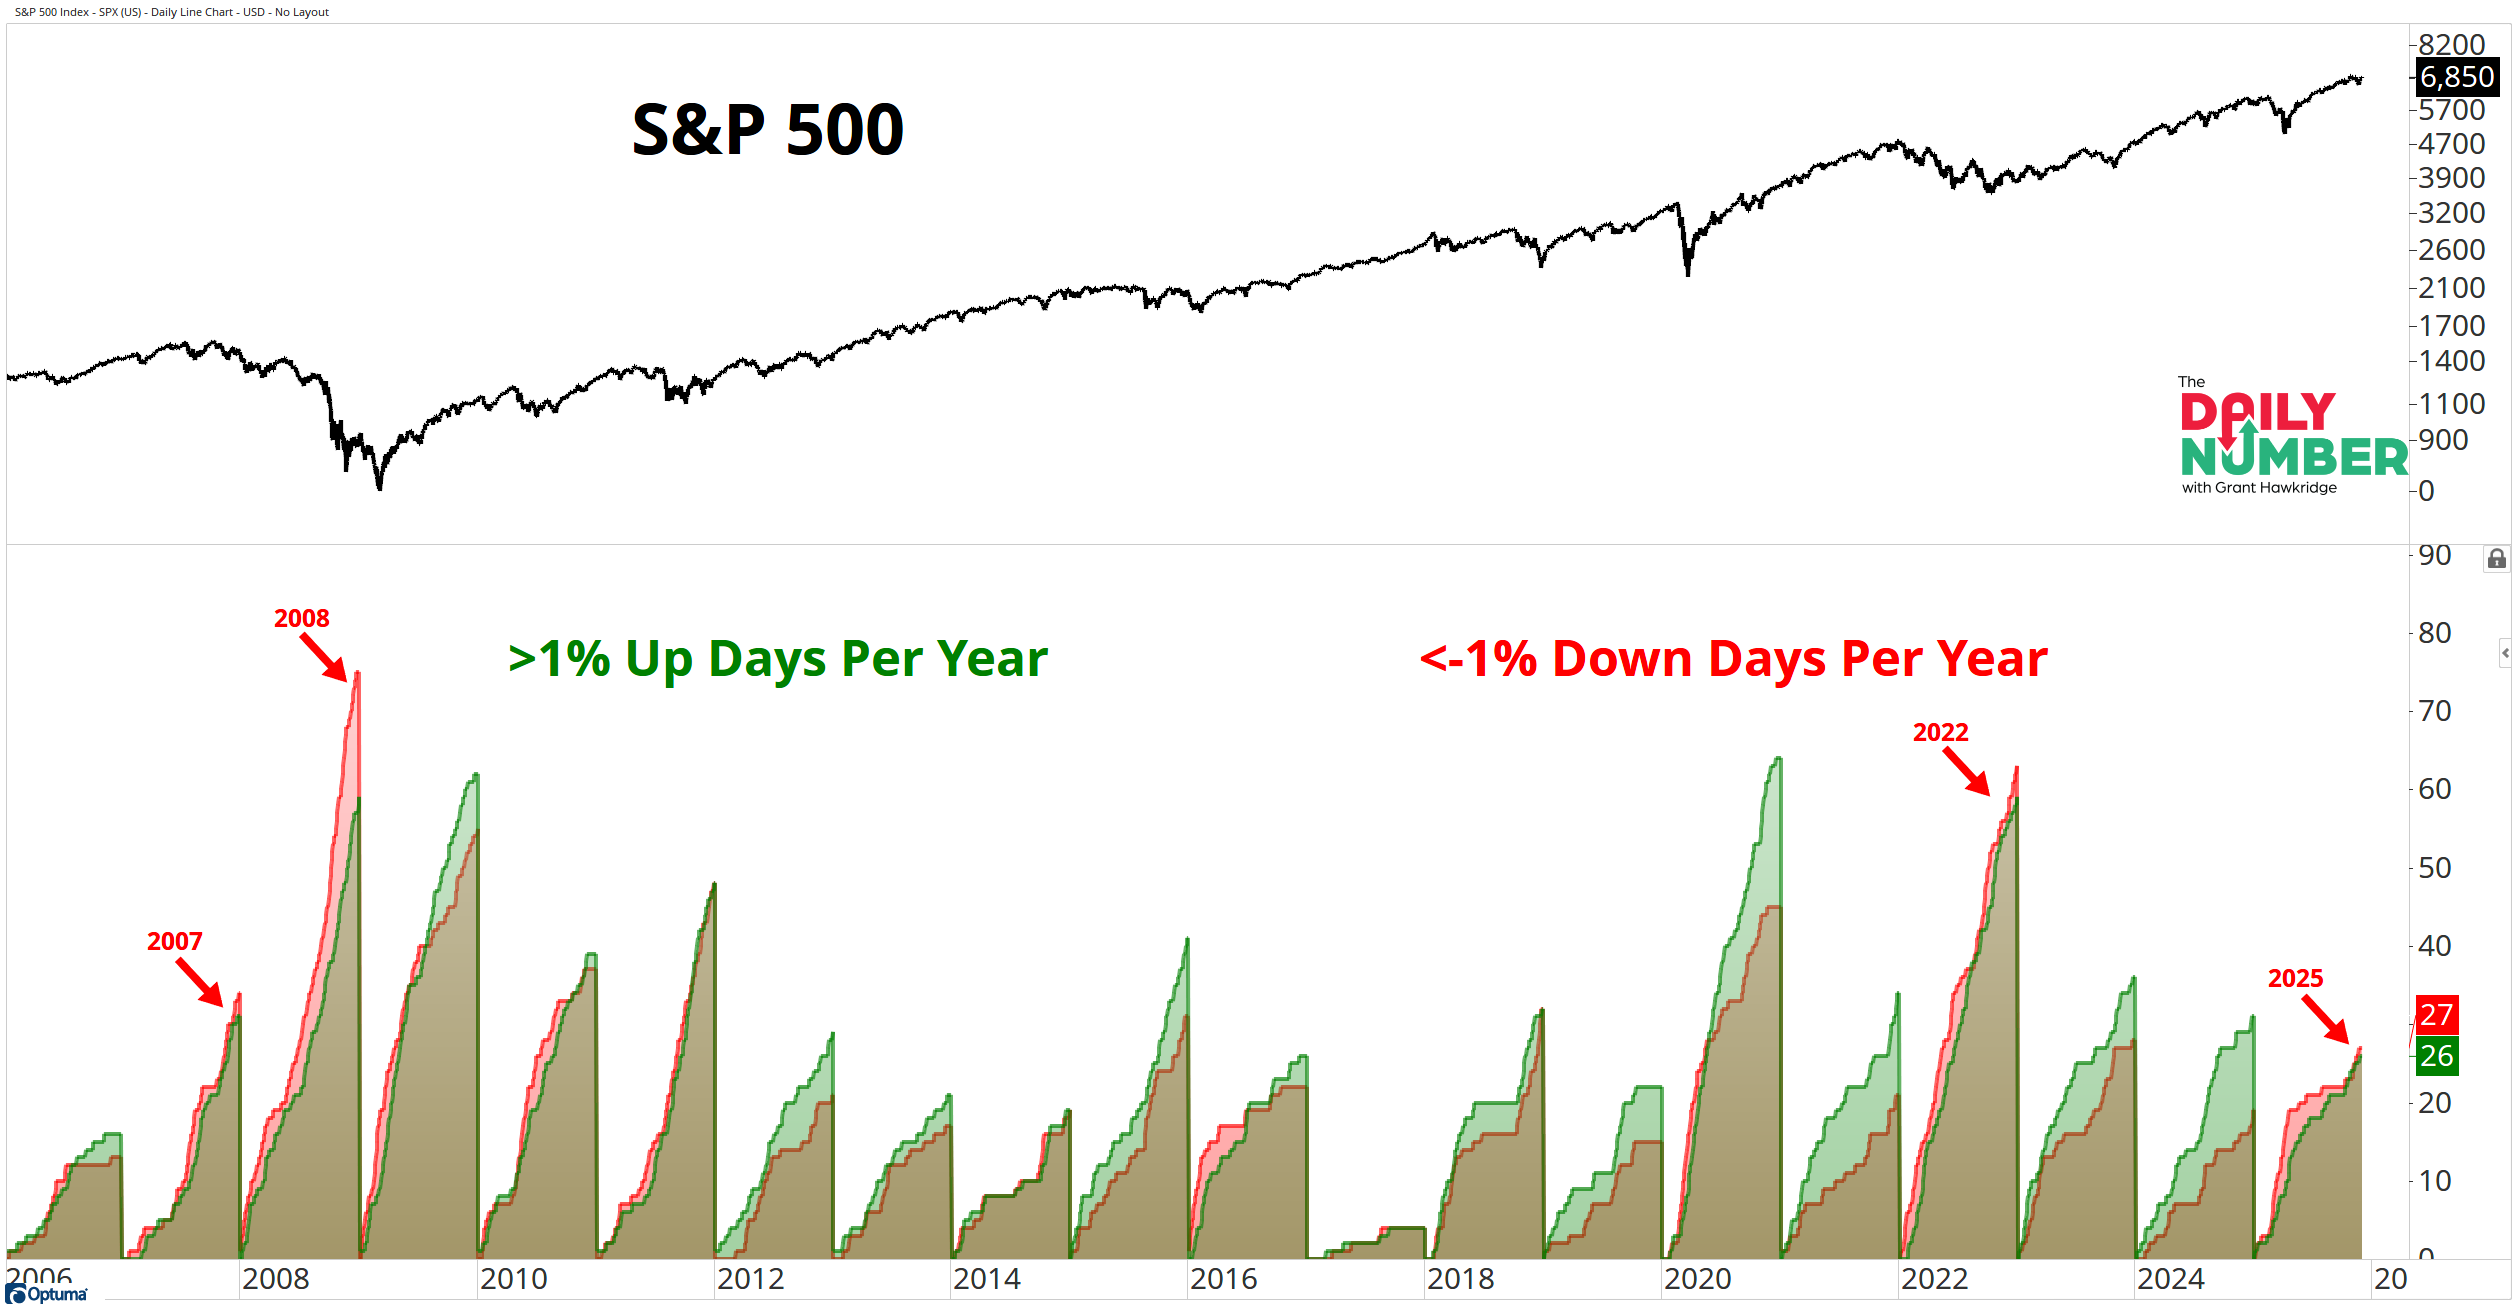
The S&P 500 has posted 27 down days of –1% or more this year and 26 up days of +1% or more.
Here’s the chart:
Let's break down what the chart shows:
The top section displays the S&P 500 in black.
The lower section displays yearly counts of up days greater than 1% in green and down days greater than –1% in red.
Each year is stacked as a running total from January to December.
The Takeaway: The tape in 2025 sits in a rare spot.
Only three years in the past twenty have ended with more –1% down days than +1% up days. Those years were 2007, 2008, and 2022. All three finished weak. All three carried stress under the surface. That is the comparison set for this year.
The current trend does not match that history.
The S&P 500 is up 16.4% year-to-date. Buyers showed up all year. Leadership rotated but stayed alive. Big stocks held trends. Growth kept pushing. You do not get a 16.4% run without steady demand.
These returns confirm strength. The volatility does not. The balance of big up days and big down days has looked more like a choppy year than a smooth one.
Right now, the gap is one day. 27 down days. 26 up days. With only one month left. One run gives buyers control. One slip hands it to the sellers.
The next decisive move comes from whichever side breaks the tie first. Who moves?
If you find my content valuable, I would greatly appreciate it if you could share it with your friends, family, and colleagues. Your help in spreading the word is invaluable in supporting our work. Thank you to all of you who share!