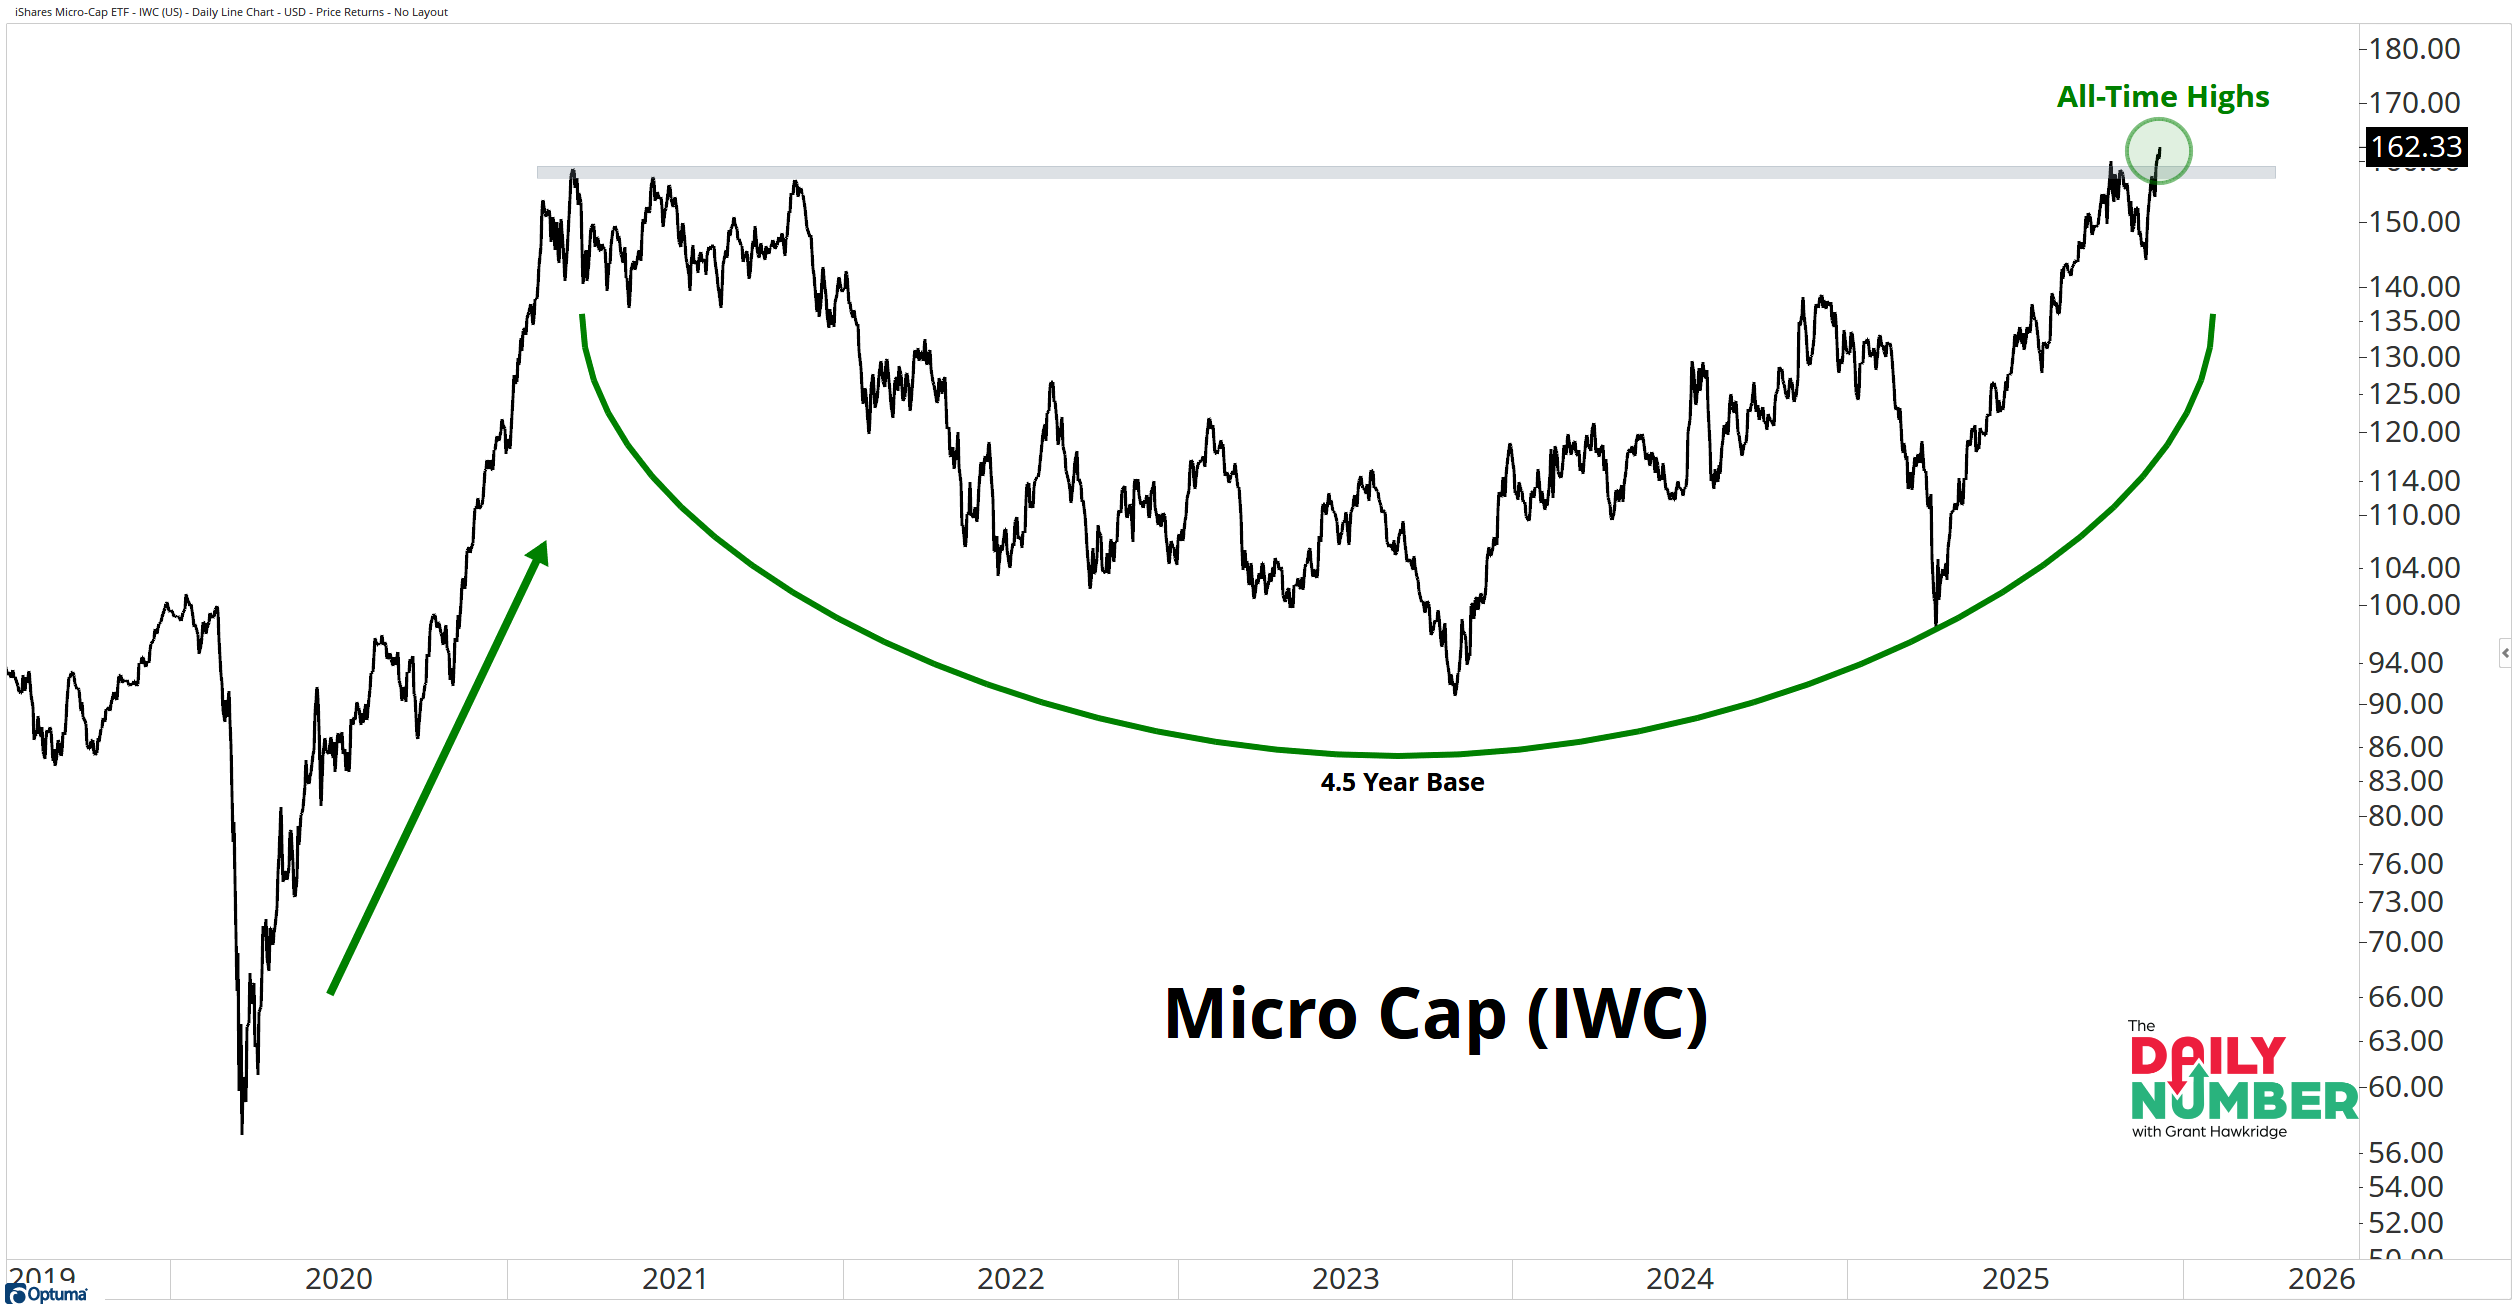
Micro caps just ripped to new all-time highs from a 4.5-year basing pattern, the kind of move you only see when risk appetite kicks in.
Here’s the chart:
Let's break down what the chart shows:
The chart displays daily price action for the Micro Cap ETF (IWC) as a black line.
The Takeaway: A 4.5-year base is not noise. It is the kind of foundation that only forms when a market spends years absorbing supply.
When that base resolves to the upside, it says buyers stepped in with conviction.
This breakout puts micro caps at new highs after a long period of dead money.
A move like this does not happen without a rise in risk appetite. Micro caps sit at the top of the risk ladder. They lag when traders are cautious. They lead when traders want exposure.
Price moving through the old ceiling tells you traders are reaching for the riskiest stocks in the market.
Long bases like this create energy. That energy gets released when the ceiling breaks. 4.5 years is a long reset for any part of the market, and now with micro caps making highs changes the tone.
It widens market participation.
And it signals to me that traders are willing to move out the risk curve.
If you find my content valuable, I would greatly appreciate it if you could share it with your friends, family, and colleagues. Your help in spreading the word is invaluable in supporting our work. Thank you to all of you who share!