NYSE Weekly Net New Highs just reached 11.4%, the highest reading since 2024.
Here’s the chart:
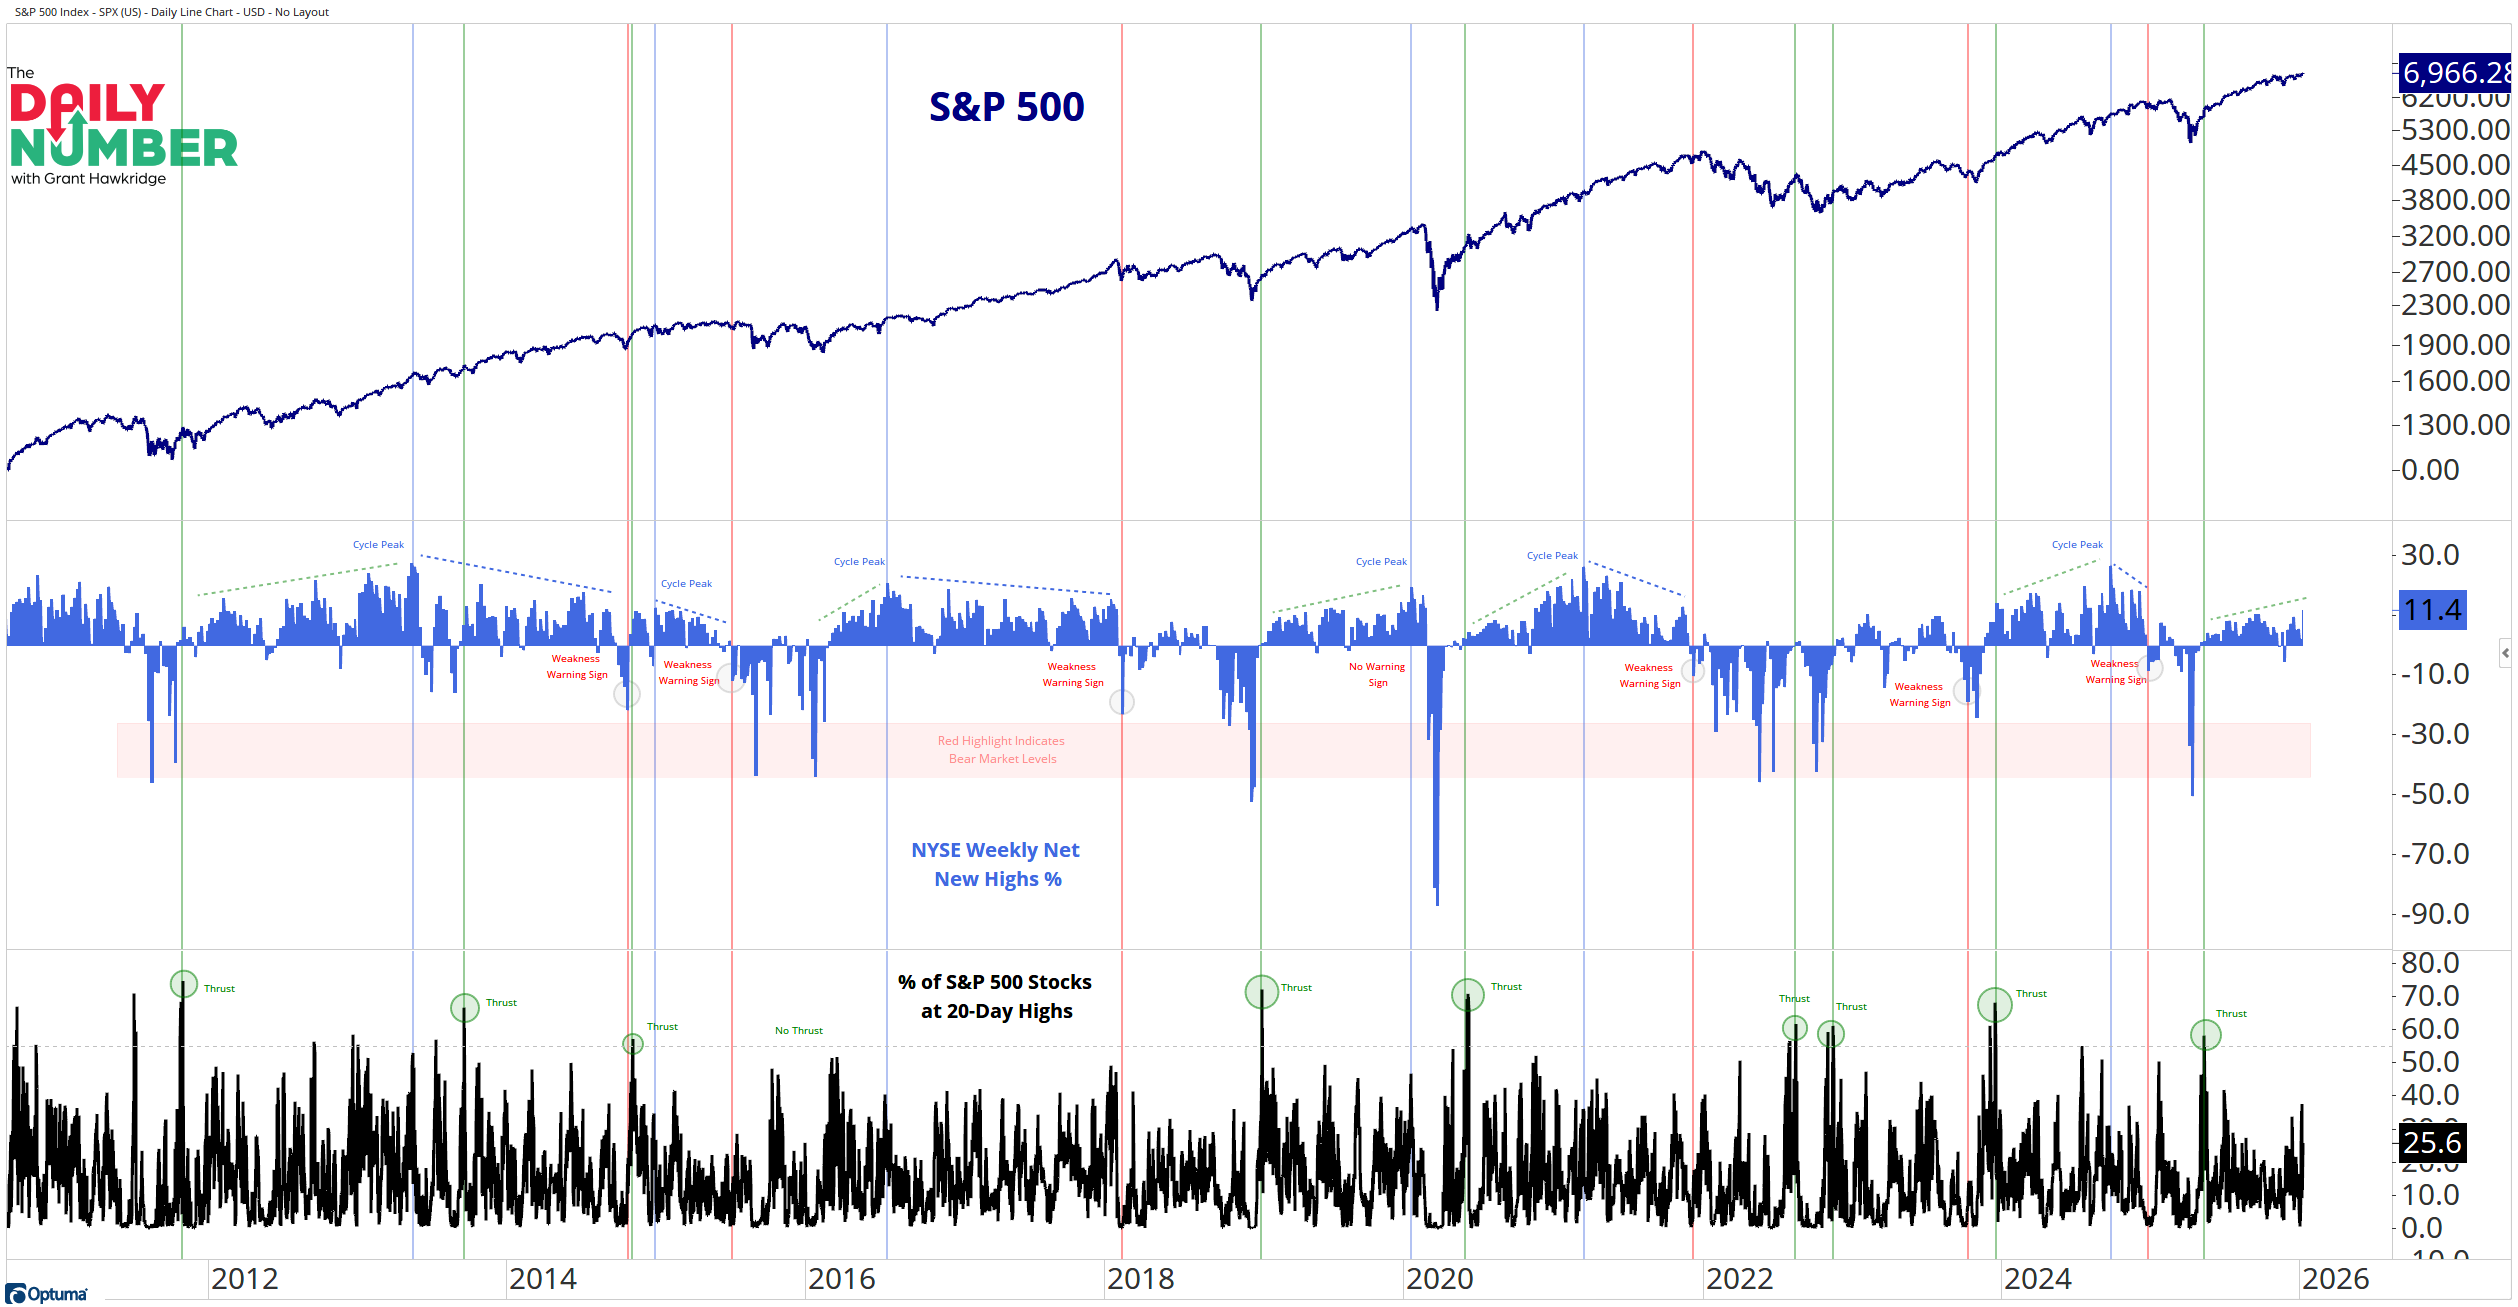
Let's break down what the chart shows:
The top panel displays the S&P 500 as a dark blue price line across the top.
The middle panel is histogram in light blue that shows the percentage of NYSE Weekly Net New Highs.
Vertical markers identify prior cycle peaks, warning areas, and thrusts.
The lower section plots the percentage of S&P 500 stocks at 20-day highs as a black line, with green circles marking thrusts.
The Takeaway: Breadth just made a new cycle high.
The NYSE Weekly Net New Highs reading pushed to 11.4%, the strongest level since 2024.
Breadth cycles start with a thrust. That is Spring. It marks the turn from contraction to expansion. What follows that thrust is Summer, the phase where participation keeps building and new highs expand.
That is the setup now.
Breadth is pushing to cycle highs, which is where trends stay alive.
New cycle highs mean more stocks are joining the move rather than backing away from it. Markets do not fail during this phase. Trouble only shows up after breadth peaks and then contracts rapidly.
This is how healthy trends behave in summer. Pullbacks get absorbed. Rotation stays internal. Money moves through the market rather than leaving it.
Summer does not mean straight up. It means the trend still has backing underneath it. Until breadth stops confirming, fading strength stays on the wrong side of the market.
Breadth is in Summer. That is where trends usually work.
That was the story in 2025, and it looks unchanged heading into 2026.
If you find my content valuable, I would greatly appreciate it if you could share it with your friends, family, and colleagues. Your help in spreading the word is invaluable in supporting our work. Thank you to all of you who share!