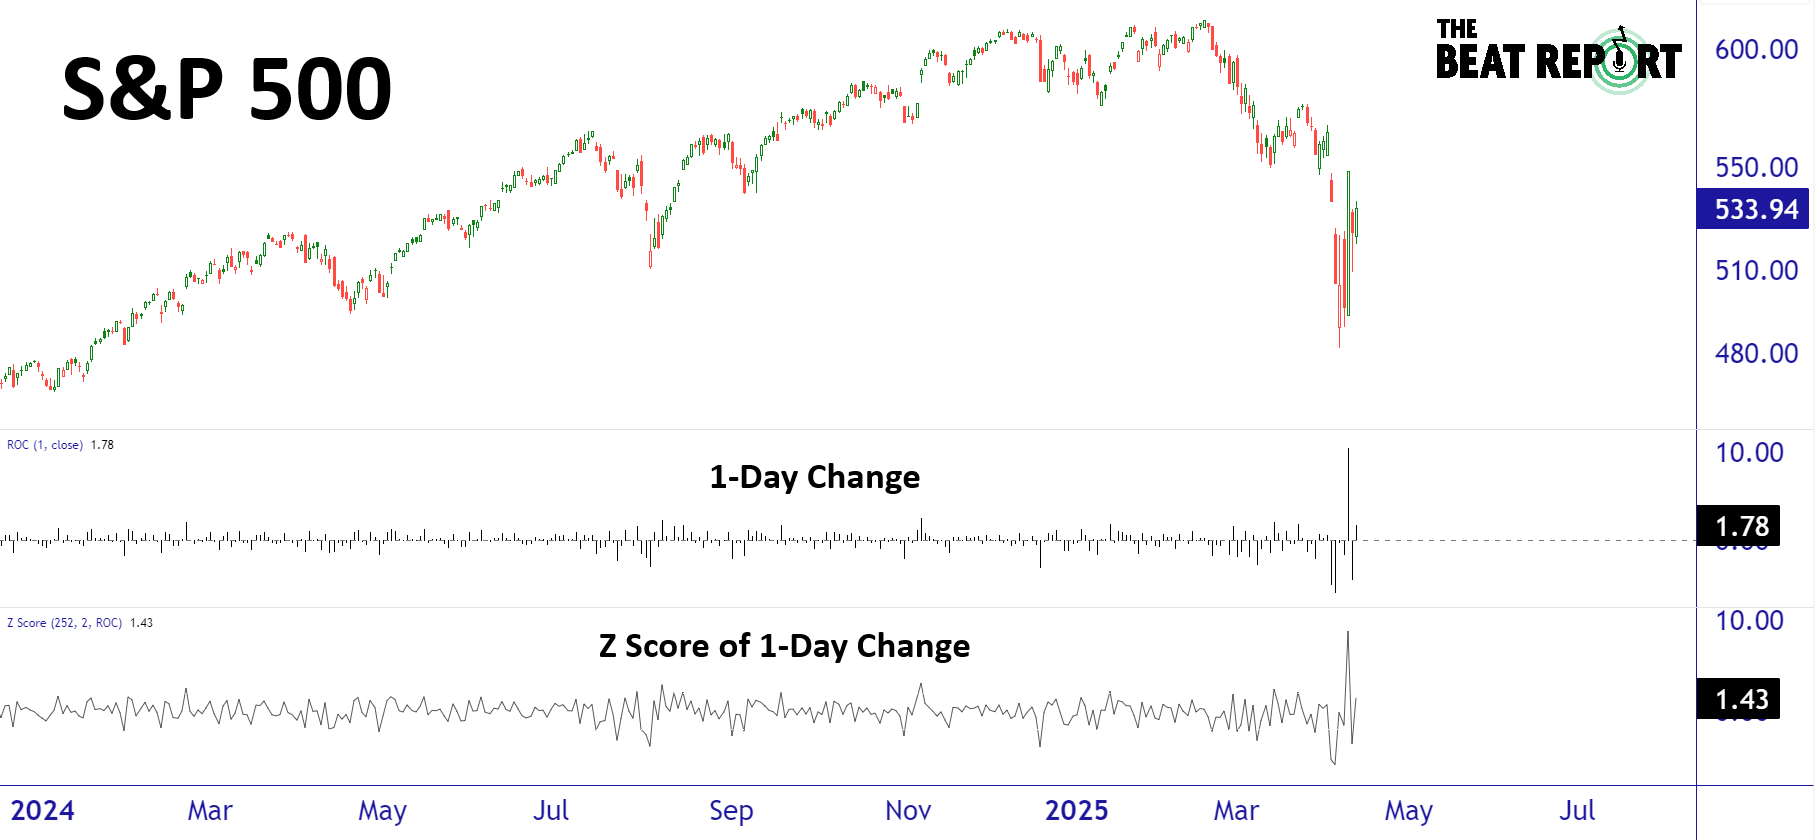
First, add the rate of change indicator with the length set to 1 and base it on the closing price.
Next, right-click on the ROC indicator (we use the default TradingView indicator) and select Add Indicator/Strategy on ROC.
From there, search for the Z-Score script (we use the script from jwammo12), make the length 252 periods, and calculate based on 1 standard deviation.
Here's what it should look like:
Now that we have the template, we can calculate the reaction score for any stock.
Here's how we do it...
In a spreadsheet, we take the z-score from the S&P 500 and subtract the stock's z-score from it.
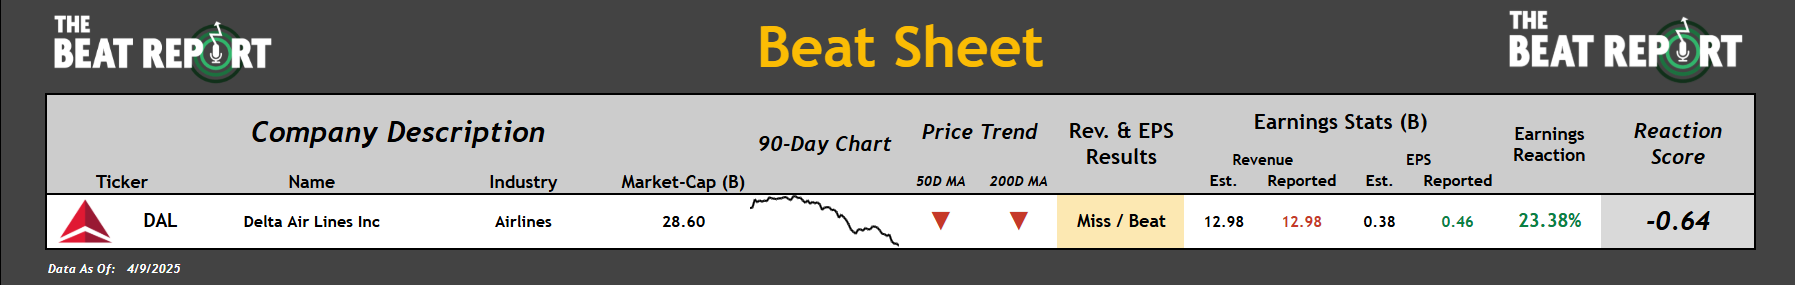
Then, we adjust for the quarterly results...
If the company reports "Miss / Miss" and the reaction is positive, it increases the raw reaction score by 25%, which means the stock was rewarded despite missing expectations.
If the company reports “Beat / Beat” and the reaction is negative, it increases the raw reaction score (which is negative) by 25%, because it means, despite beating expectations, the stock was punished.
If the company reports "Miss / Beat" or "Beat / Miss", it increases the raw reaction score by 10% (whether it is positive or negative).
If none of the above happen (e.g., "Beat / Beat" and rally, or "Miss / Miss" and drop), it reverts to the raw reaction score.
Here's a powerful example of why we use the reaction score:
Wednesday, April 9th, 2025, was one of the best days in stock market history.