My Fear or Strength Model was in a bearish mode for the last 22 trading days. However, as of Monday, the model has switched to bullish mode.
Here’s the chart:
(right-click and open image in new tab to zoom in)
Let's break down what the chart shows:
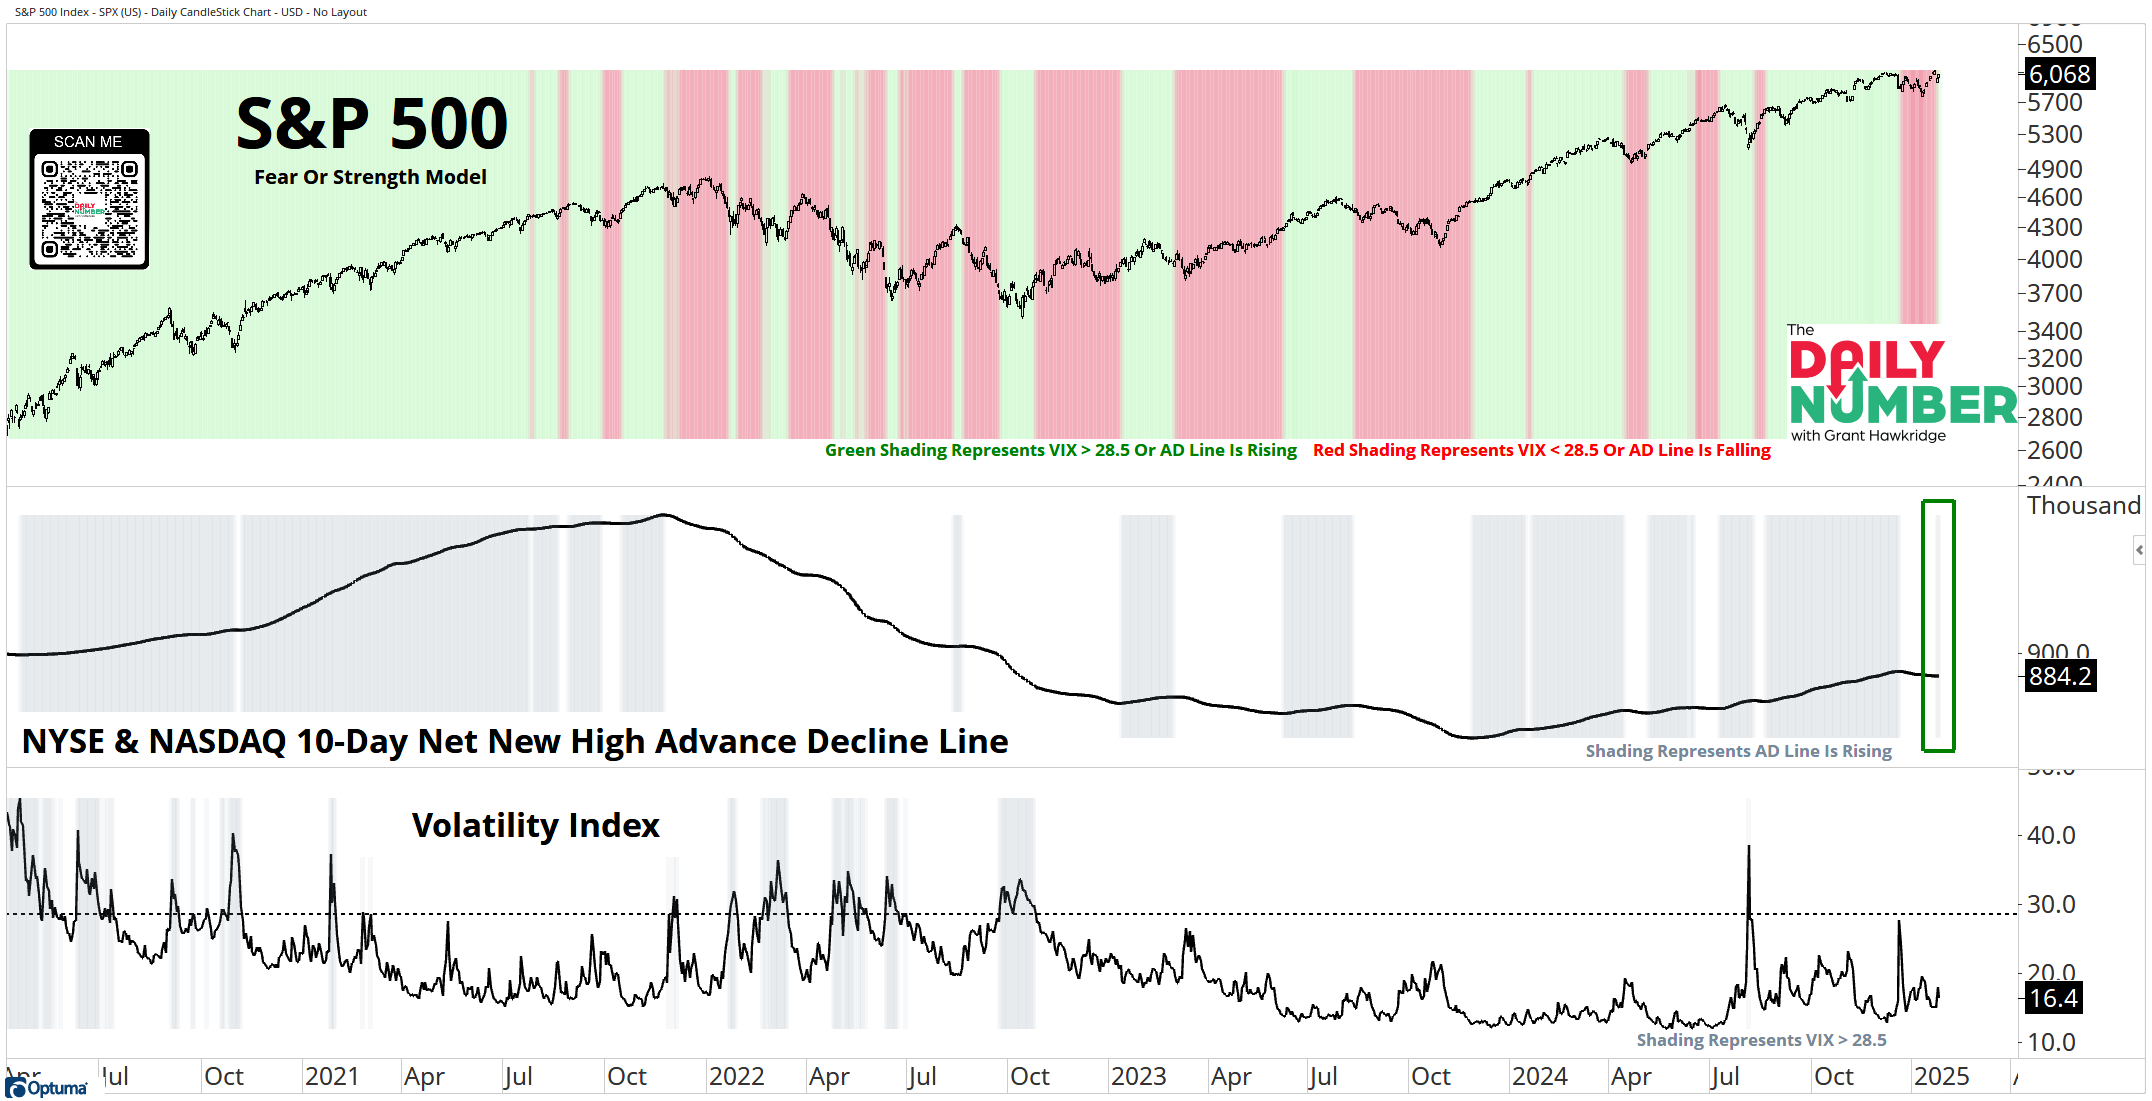
The black line in the top panel is the S&P 500 index price.
The green shading highlights the model is in bullish mode.
The red shading highlights the model is in bearish mode.
The black line in the middle panel is the 10-day average of the NYSE+NASDAQ net new high advance-decline line - The model's “strength” component. The gray shading represents the AD line is rising.
The black line in the bottom panel is the Volatility index, which is the model's “fear” component. The gray shading represents the VIX reading above 28.5.
The Takeaway: For the past 22 days, this model has remained in bearish mode, which led me to be cautious and avoid allocating new capital to the market.
However, Over the past nine trading days, market breadth has improved, with the number of new highs on the NYSE and NASDAQ consistently outpacing new lows. As a result, my NYSE and NASDAQ net new high A-D line has risen, causing my ‘Fear or Strength’ tactical model to shift back into bullish mode. This supports a tactically bullish stance, even though there are some challenges ahead for the bulls.
With this switch to bullish mode, It might be time for me to start looking for new opportunities with strong tactical setups to allocate some of my capital back into the market.
If you find my content valuable, I would greatly appreciate it if you could share it with your friends, family, and colleagues. Your help in spreading the word is invaluable in supporting our work. Thank you to all of you who share!