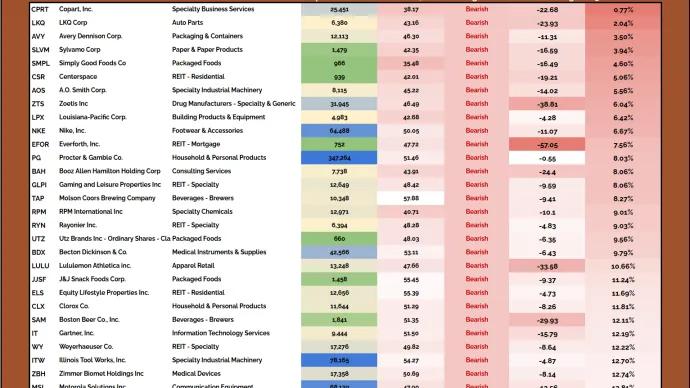
Steve Strazza The Short Report From the Desk of Steve Strazza @SstrazzaWhen investing in the stock market, we always want to approach it as "a market of stocks."Regardless of the environment, there are always stocks showing... July 21, 2026 All Star Charts Premium Short Report ASC Premium Members Only
Alfonso De Pablos, CMT I'm Buying Energy Again I added energy stocks back into my portfolio for the first time in a while.The reason is simple: I don't think the energy trade is dead. If anything, I think it's starting to come back to life.After ... July 21, 2026 Alfonso's Daily Note ASC Alfonso
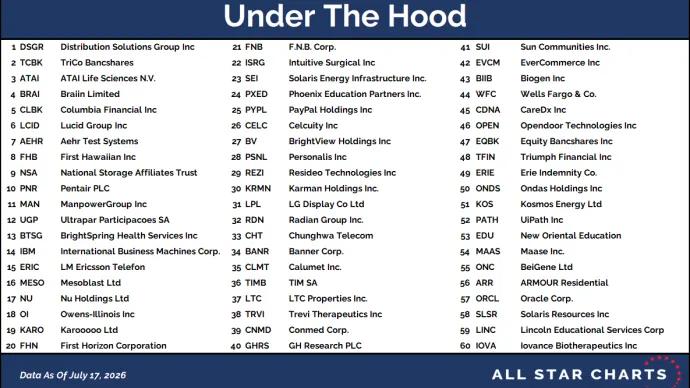
Steve Strazza Under The Hood From the Desk of Steve Strazza @Sstrazza.Welcome back to Under the Hood, where we'll cover all the... July 20, 2026 All Star Charts Premium ASC Under The Hood Stocks Steve Strazza Premium Members Only
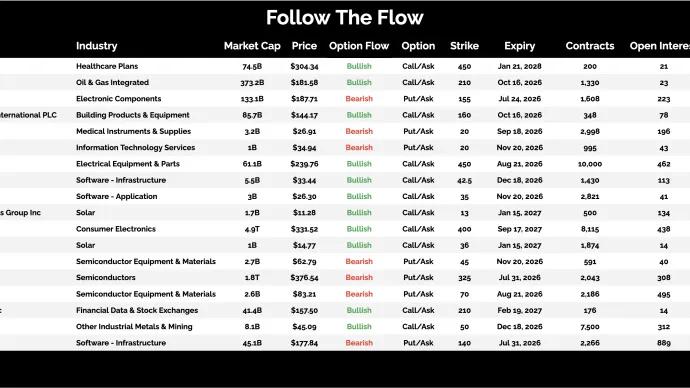
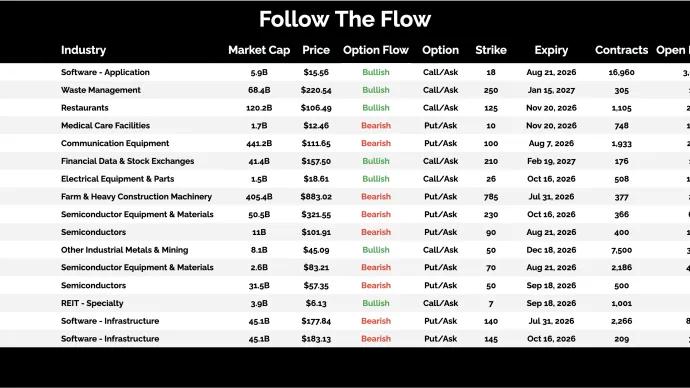
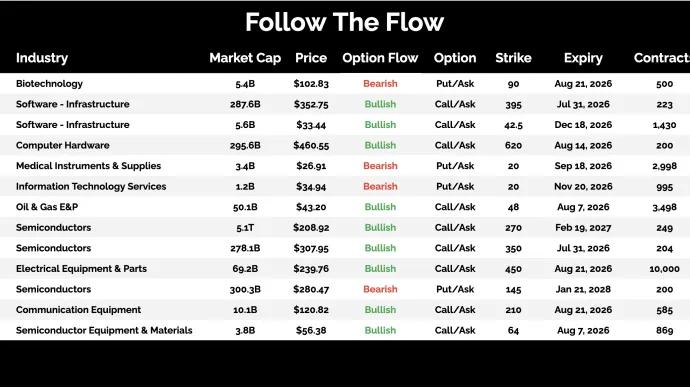
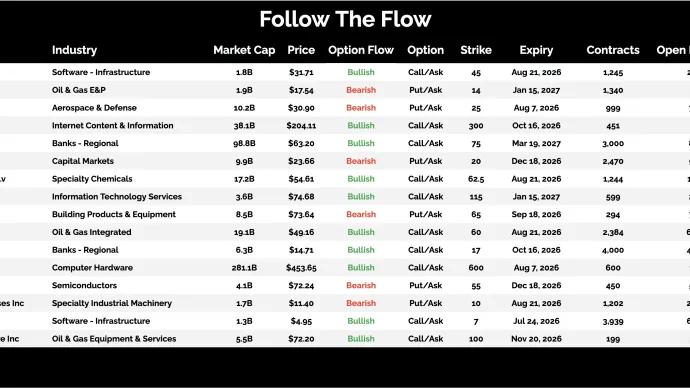
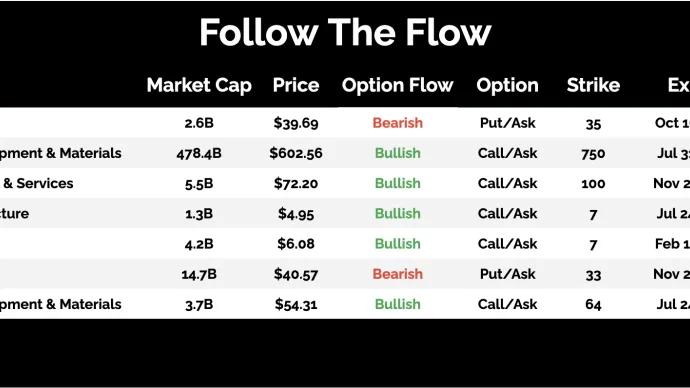
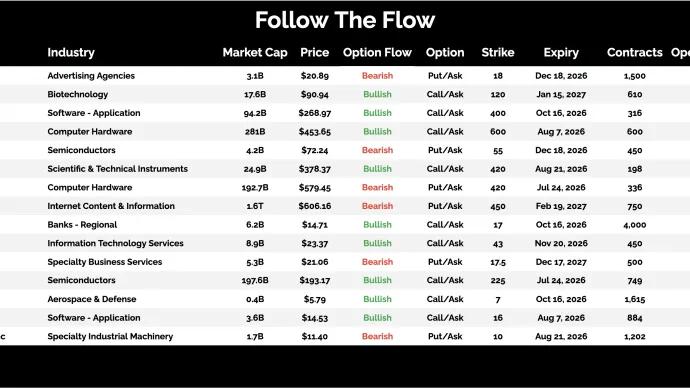
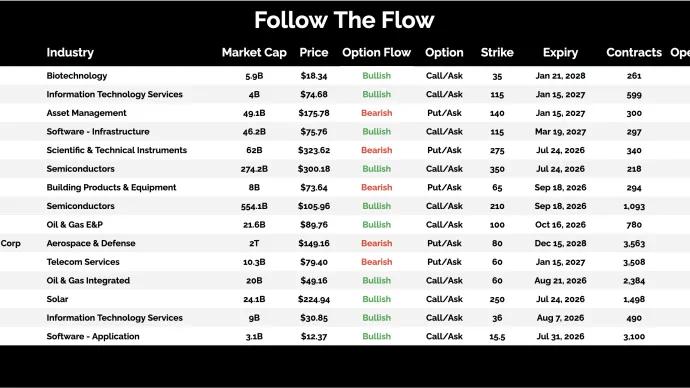
Steve Strazza Follow the Flow Every weekend I dig through the names that experienced the most interesting unusual options activity. We’re looking for trades that stood out, whether it was large in size or a very aggressive strike selection.... July 19, 2026 All Star Charts Premium ASC Follow The Flow Steve Strazza Members Only
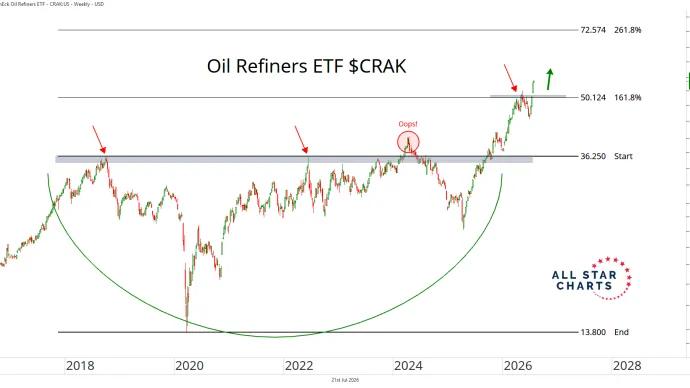
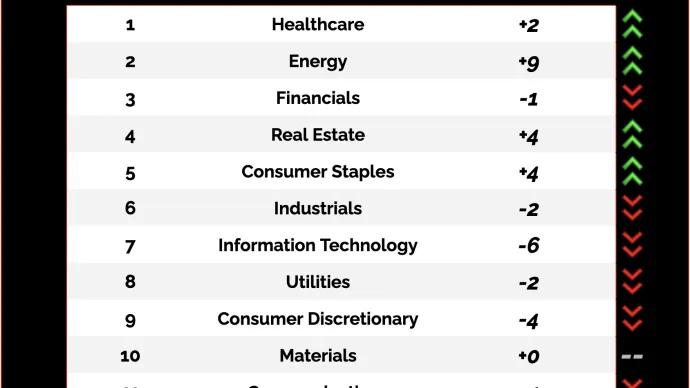
Steve Strazza Top Down Trade of the Week Refiners lead the rebound in energy stocks Welcome back for another Top Down Trade of the Week.This is a classic leadership scan.We start with the best sectors, then drill into the subgroups. We pick one, and then take a look at... July 18, 2026 All Star Charts Premium Strazza ASC Premium Stocks Top Down Trade Of The Week Members Only
Steve Strazza The Daily Flow Is the market warming back up to clean energy, coffee, and rideshare all at once? This note highlights a select group of stocks showing the most unusual — and highly directional — options activity.The goal is simple: follow the big money and trade in the direction of the underlying... July 17, 2026 All Star Charts Premium ASC Follow The Flow Steve Strazza
Ricardo Sarraf 2 to 100 Club Monthly Members Call - July 2026 Hey 2-to-100 Club,Today's strategy session had a guest spot: Dylan Tanen. He's a core member of our analyst team here at All Star Charts and a good friend. He joined to walk through what he's seeing across the intermarket landscape... July 17, 2026 2 to 100 Club 2-to-100 Club Premium ASC Stocks Ricardo Sarraf Video Members Only
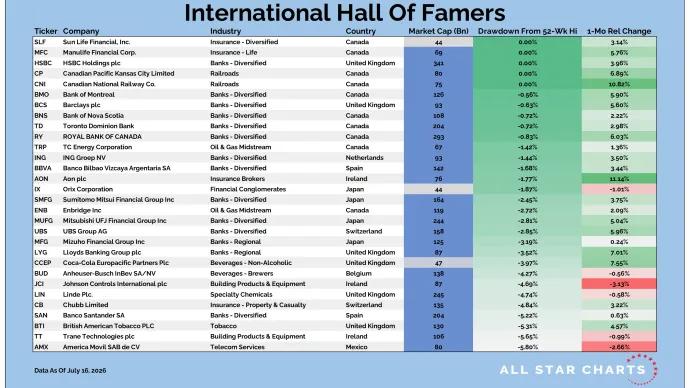
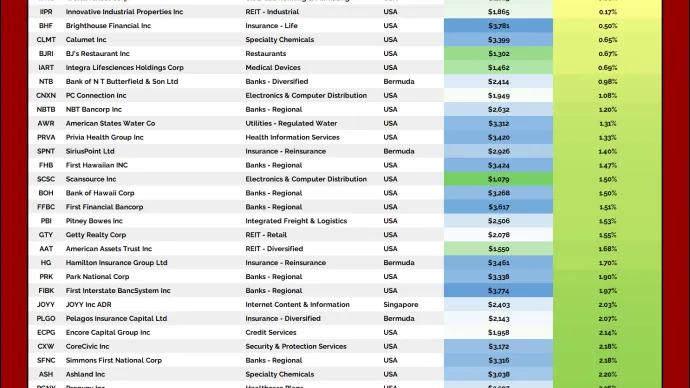
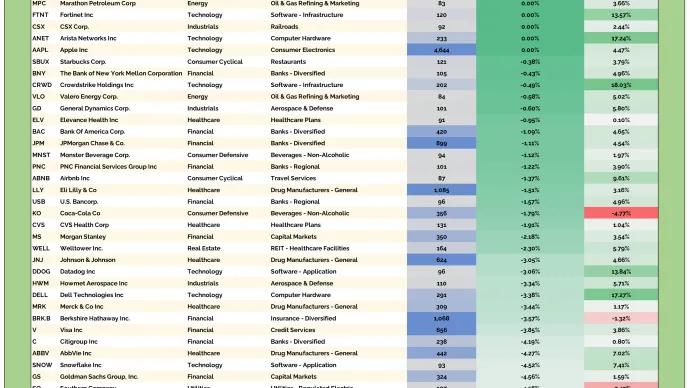
Steve Strazza International Hall of Famers From the desk of Steve Strazza @SstrazzaOur International Hall of Famers list is composed of the 100 largest US-listed international stocks, or ADRs.We've also sprinkled in some of the largest ADRs... July 17, 2026 All Star Charts Premium Strazza Stocks Premium ASC International Hall Of Famers Members Only
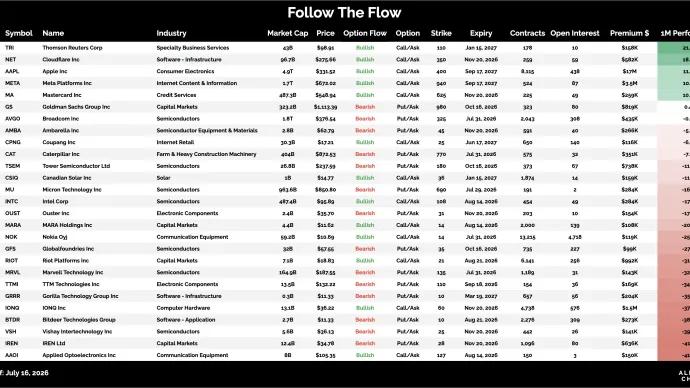
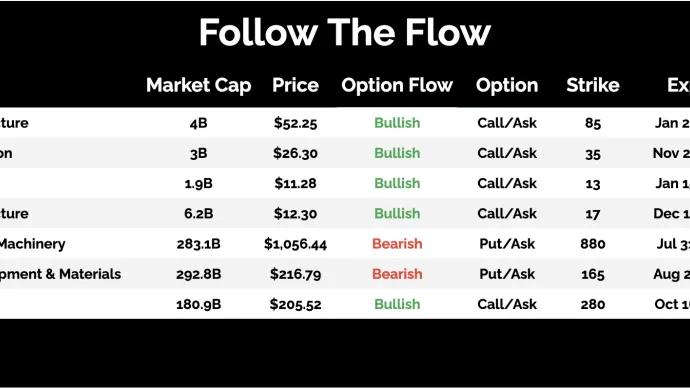
Steve Strazza The Daily Flow Did you catch the flow in beaten solar, a semi giant getting sold, and the biggest premium on the whole board? This note highlights a select group of stocks showing the most unusual — and highly directional — options activity.The goal is simple: follow the big money and trade in the direction of the underlying... July 16, 2026 All Star Charts Premium ASC Follow The Flow Steve Strazza
Steve Strazza The Daily Flow Where is the money leaning as payments, app software, and solar all light up green? This note highlights a select group of stocks showing the most unusual — and highly directional — options activity.The goal is simple: follow the big money and trade in the direction of the underlying... July 15, 2026 All Star Charts Premium ASC Follow The Flow Steve Strazza
Ricardo Sarraf 2 to 100 Club From the desk of Ricardo Sarraf @nullchartsEvery cycle produces a handful of stocks that go from emerging to enormous — names that compound 10x, 20x, 50x before they become portfolio fixtures. But they... July 15, 2026 2 to 100 Club All Star Charts Premium 2-to-100 Club Premium ASC Stocks Ricardo Sarraf Members Only
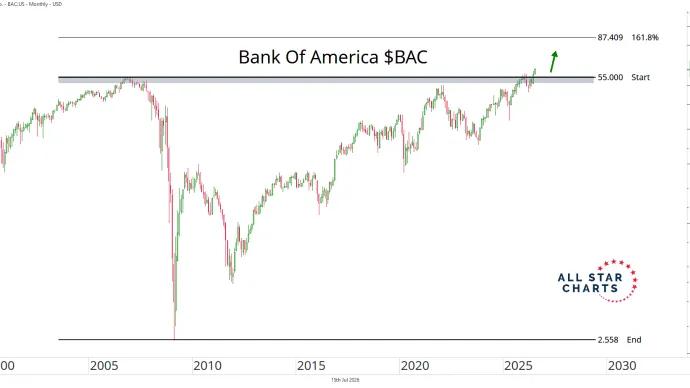
Alfonso De Pablos, CMT I'm Buying One of America's Biggest Banks "You can't have a bull market without banks."It's one of those phrases you've probably heard a hundred times.But have you ever stopped to think about why?The answer is actually pretty simple... July 15, 2026 Alfonso's Daily Note ASC Alfonso
Steve Strazza The Daily Flow Why is real paper landing in a small-cap software name, an energy laggard, and a beaten-down optical play? This note highlights a select group of stocks showing the most unusual — and highly directional — options activity.The goal is simple: follow the big money and trade in the direction of the underlying... July 14, 2026 All Star Charts Premium ASC Follow The Flow Steve Strazza
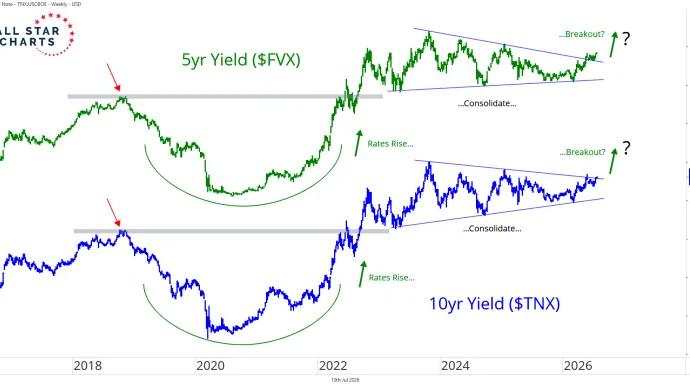
Alfonso De Pablos, CMT Decision Time for Bonds One of the biggest lessons I've learned over the years is that no market moves in isolation.Just because you trade stocks doesn't mean you can ignore what's happening in bonds, currencies, or commodities.Everything is connected.... July 14, 2026 Alfonso's Daily Note ASC Alfonso
Steve Strazza The Daily Flow Big oil call buying stacking up while a software name draws size This note highlights a select group of stocks showing the most unusual — and highly directional — options activity.The goal is simple: follow the big money and trade in the direction of the underlying... July 13, 2026 All Star Charts Premium ASC Follow The Flow Steve Strazza
Steve Strazza The Minor Leaguers From the Desk of Steve Strazza @SstrazzaWelcome to The Minor Leaguers.We've had some great trades come out of this small-cap-focused column since we launched it back in 2020 and... July 13, 2026 All Star Charts Premium Minor Leaguers ASC Stocks Steve Strazza Premium Small Caps Members Only
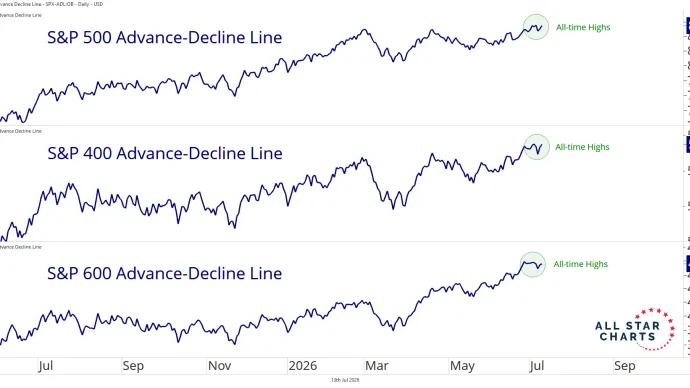
Alfonso De Pablos, CMT Breadth Is Still Bullish One of the strongest pieces of evidence supporting this bull market has nothing to do with where the major indexes are trading.It has to do with participation.One of my favorite ways to measure that is through the Advance-Decline Line.... July 13, 2026 Alfonso's Daily Note ASC Alfonso
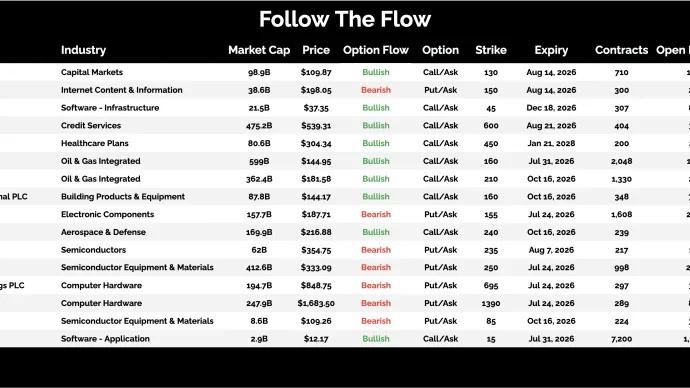
Steve Strazza Follow the Flow Every weekend I dig through the names that experienced the most interesting unusual options activity. We’re looking for trades that stood out, whether it was large in size or a very aggressive strike selection.... July 12, 2026 All Star Charts Premium ASC Follow The Flow Steve Strazza Members Only
Steve Strazza Top Down Trade of the Week This train is on track for new highs Welcome back for another Top Down Trade of the Week.This is a classic leadership scan.We start with the best sectors, then drill into the subgroups. We pick one, and then take a look at... July 11, 2026 All Star Charts Premium Strazza ASC Premium Stocks Top Down Trade Of The Week Members Only
Steve Strazza The Daily Flow New money in old sectors, and three names getting positioned before the crowd catches on This note highlights a select group of stocks showing the most unusual — and highly directional — options activity.The goal is simple: follow the big money and trade in the direction of the underlying... July 10, 2026 All Star Charts Premium ASC Follow The Flow Steve Strazza
Ricardo Sarraf 2 to 100 Club Welcome Members Call - July 2026 Hey guys. Today we welcomed a lot of new 2-to100 Club members. We covered a lot, so here's the short version:... July 10, 2026 2 to 100 Club 2-to-100 Club Premium ASC Stocks Ricardo Sarraf Video Education Members Only
Steve Strazza The Hall of Famers From the desk of Steve Strazza @SstrazzaOur Hall of Famers list is composed of the 150 largest US-based stocks.These stocks range from the mega-cap growth behemoths like Apple and Microsoft – with... July 10, 2026 All Star Charts Premium Stocks Hall Of Famers ASC Premium Strazza Members Only
Steve Strazza The Daily Flow One breakout in hardware, one base flipping bullish in software, one regional bank coiling for the next leg This note highlights a select group of stocks showing the most unusual — and highly directional — options activity.The goal is simple: follow the big money and trade in the direction of the underlying... July 9, 2026 All Star Charts Premium ASC Follow The Flow Steve Strazza
Steve Strazza The Daily Flow Down a lot, up a lot, and priced for a bounce nobody's watching This note highlights a select group of stocks showing the most unusual — and highly directional — options activity.The goal is simple: follow the big money and trade in the direction of the underlying... July 8, 2026 All Star Charts Premium ASC Follow The Flow Steve Strazza