After being hit hard in 2025, the group has spent most of the year repairing damage and trying to find its footing while much of the market has gone vertical.
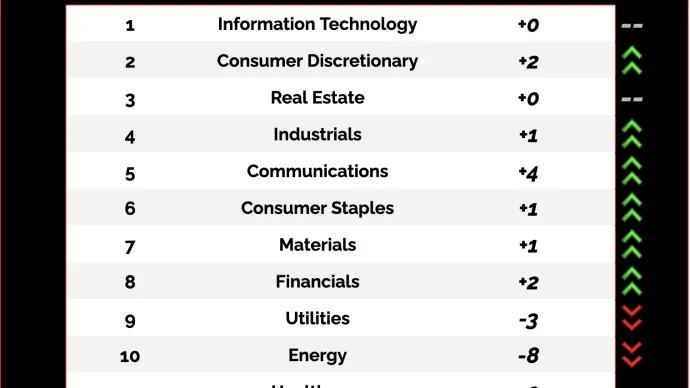
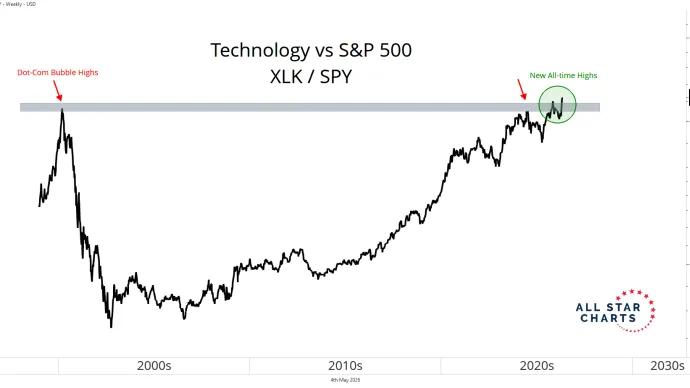
When you go back and study every bull market over the past century, one thing shows up again and again — Technology tends to be one of the most consistent leadership groups.
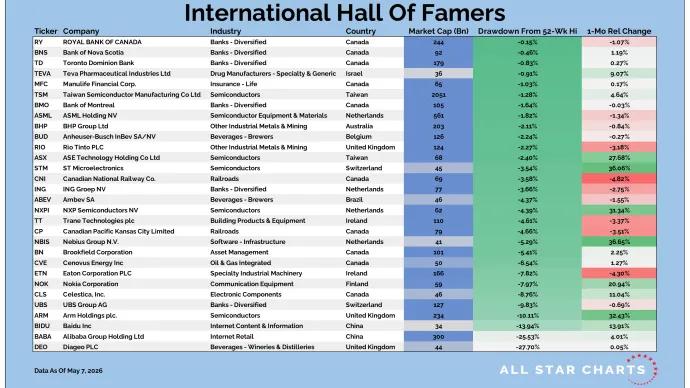
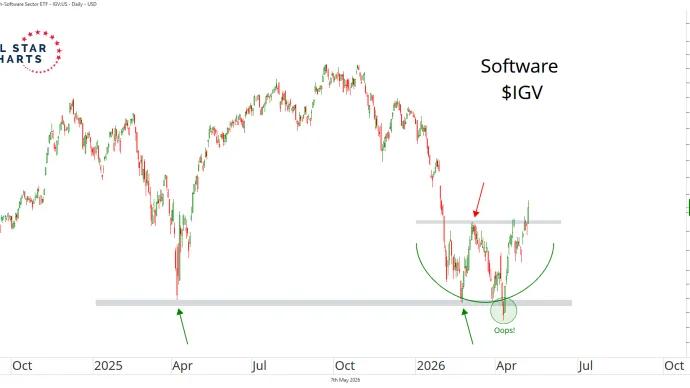
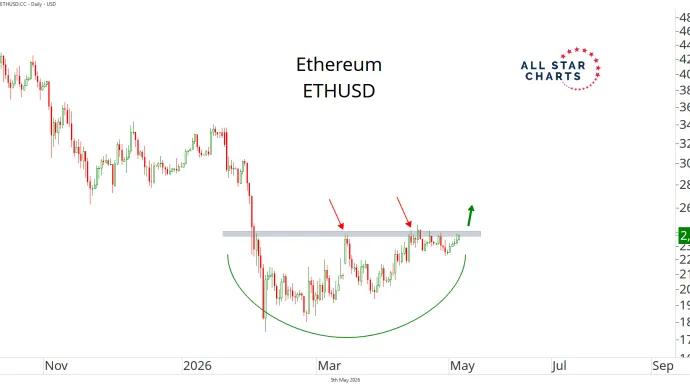
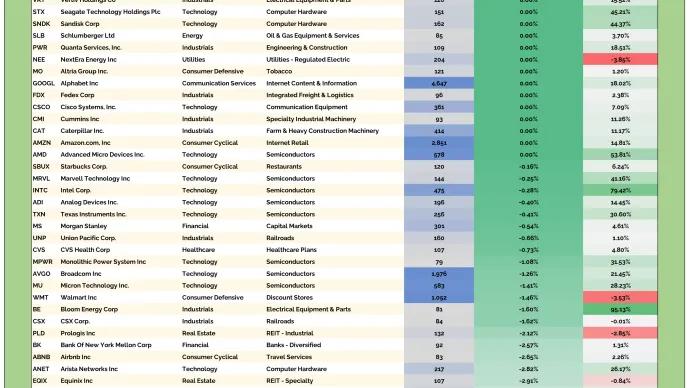
The big theme was a powerful comeback in tech — led by mega-cap names. Semiconductors continued to act as leadership, while software found support and bounced right on cue.
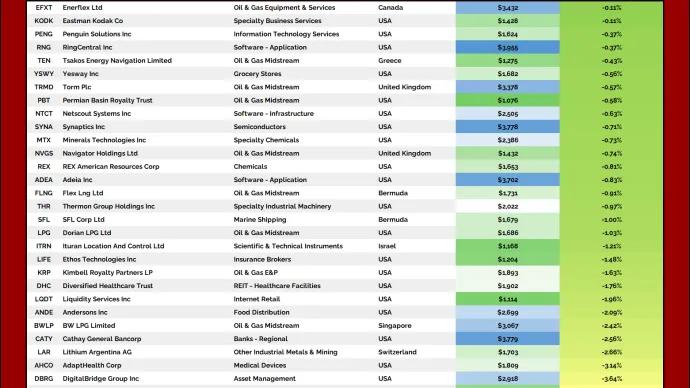
At the same time, the Q1 leaders quietly stepped...