The January Barometer (January's percentage change for the S&P 500) for 2025 showed a positive return of 2.70%.
Here’s the data table:
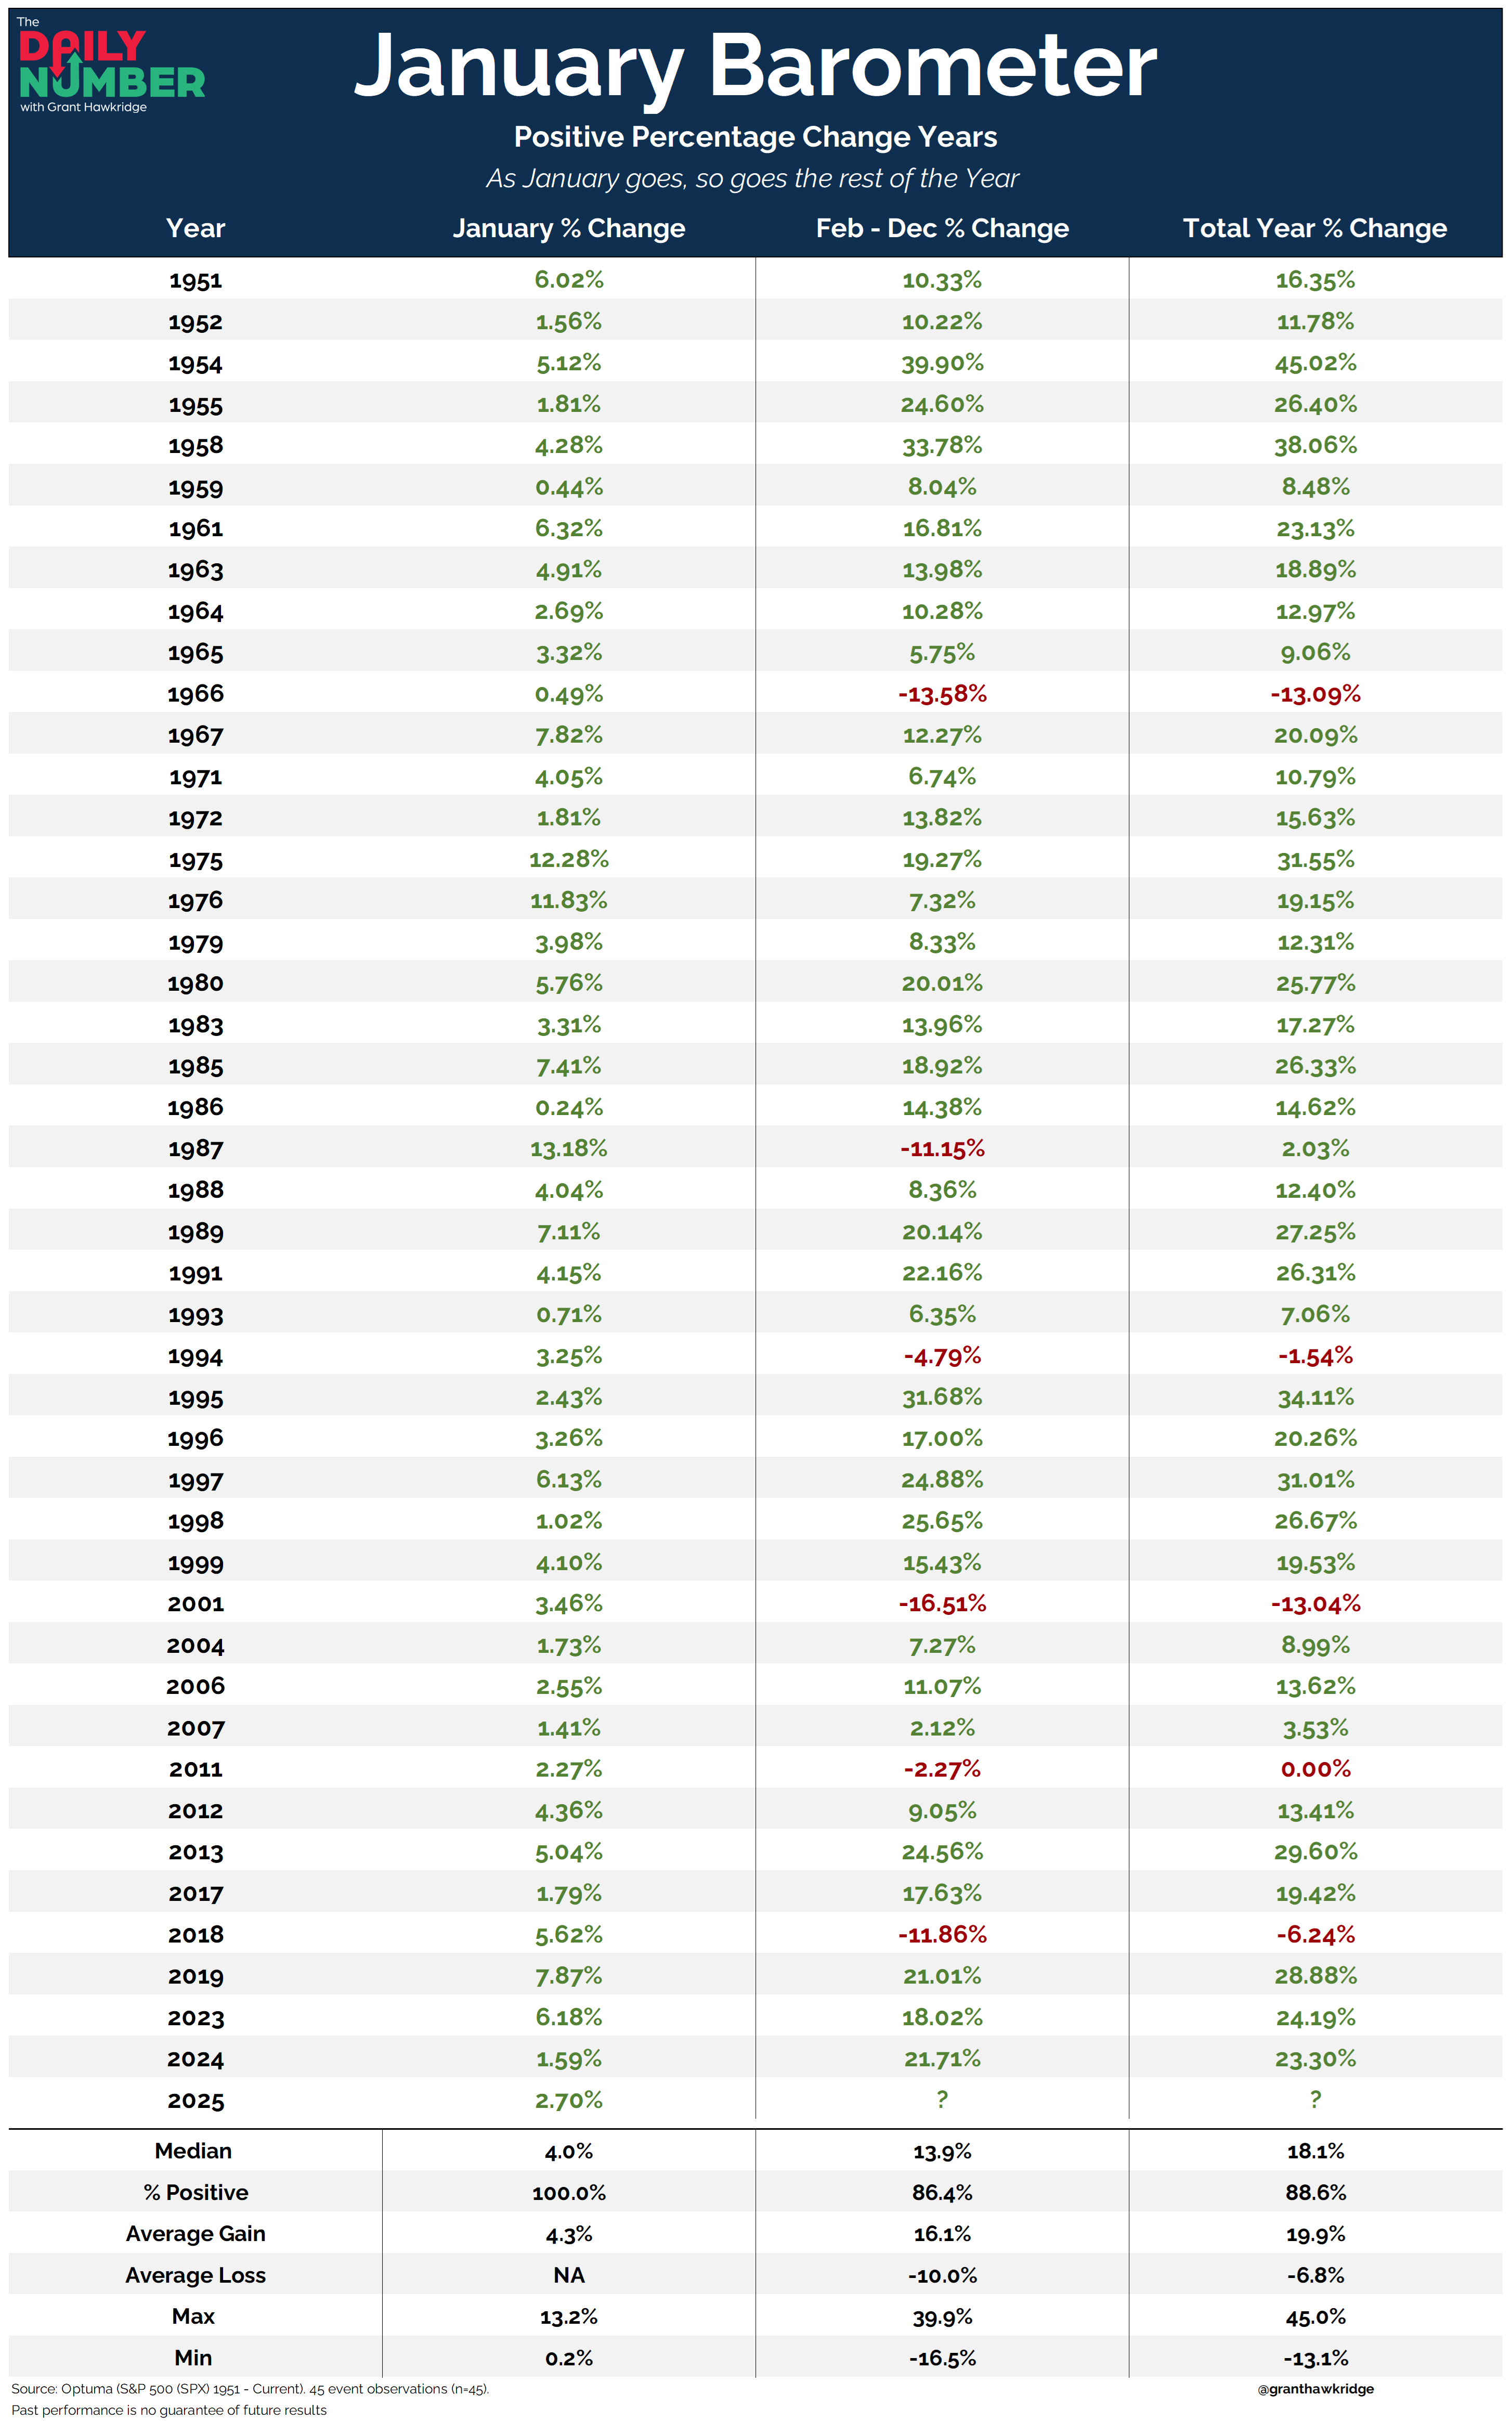
Let's break down what the table shows:
The first column lists the years the S&P 500 experienced a positive gain. The second column indicates the percentage change for January. The third column represents the percentage change from February to December. The fourth column shows the overall full-year return. At the bottom is a statistical table for each of these columns.
The Takeaway: The saying goes, "As January goes, so goes the rest of the Year."
The January Barometer is a seasonality tool that suggests that January's returns may predict the rest of the year's performance.
Since 1951, this indicator has been positive 45 times (including 2025). When it is positive, it has an average yearly gain of 19.9%, which is above the average yearly return of the S&P 500. Of the previous 44 years with a positive January return, 88.6% have finished the year on a positive note.
These figures are not bad if you ask me.
However, there will always be a statistical debate over whether this indicator is a reliable predictor of the performance of the S&P 500 Index. In my opinion, it's just one piece of the puzzle, and with January this year showing a gain of 2.70%, this data point goes into my bullish bucket.
If you find my content valuable, I would greatly appreciate it if you could share it with your friends, family, and colleagues. Your help in spreading the word is invaluable in supporting our work. Thank you to all of you who share!
If you ever feel overwhelmed by the amount of financial data that comes out every minute of every day, we've got you covered. The Daily Number - Our top data point each market day.