S&P 500 Sees Another 1% Drop — Should You Be Concerned?📉
May 21, 2025
Today's number is... 20
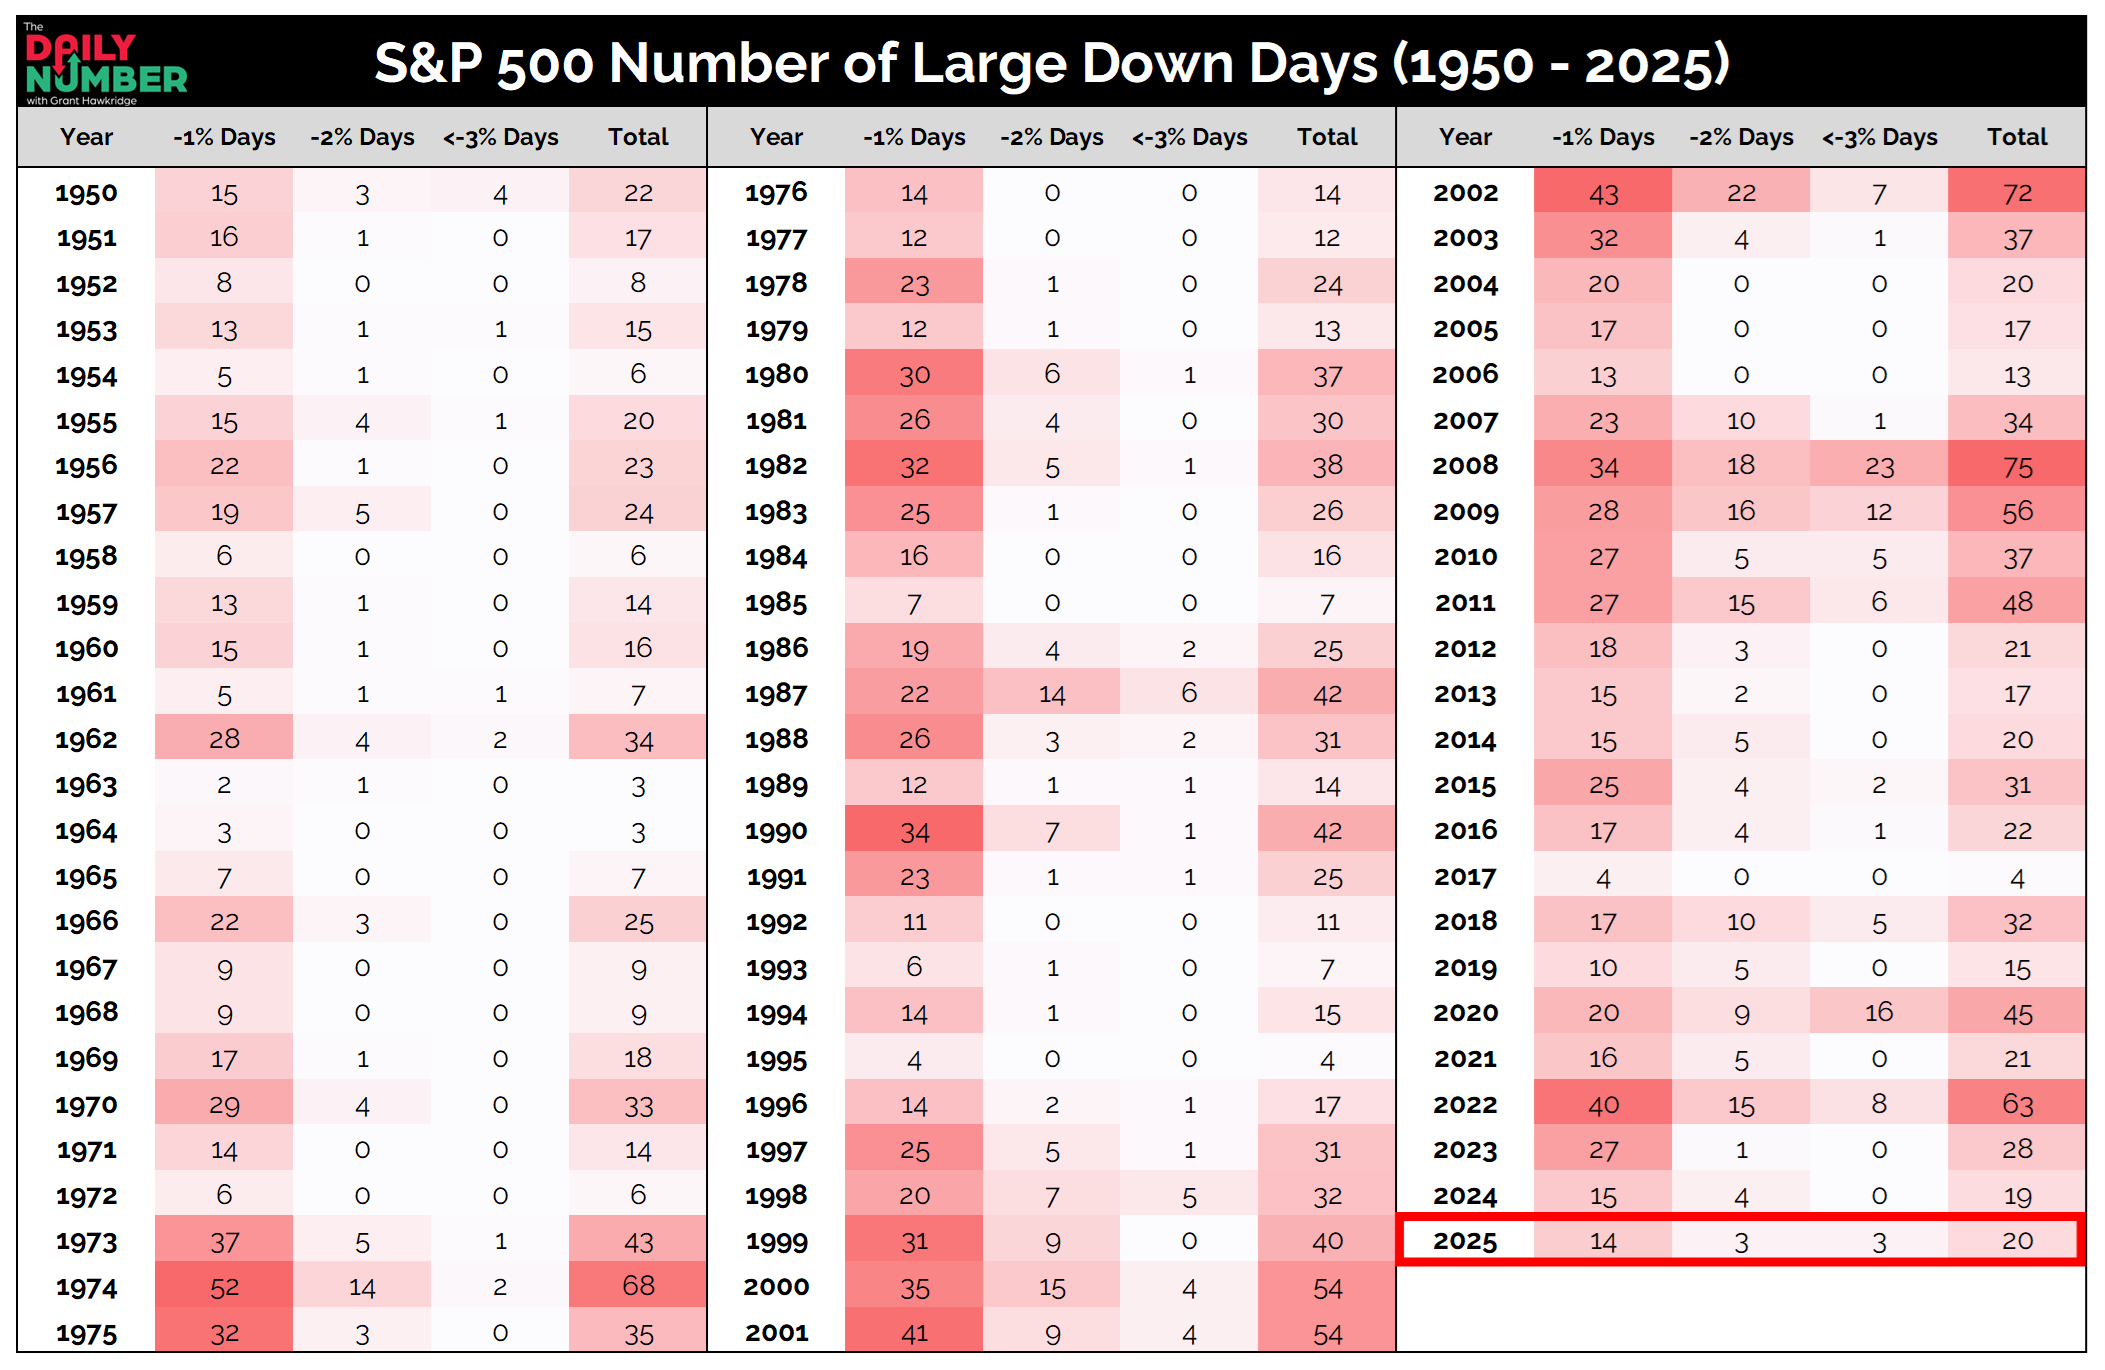
Yesterday, we saw the S&P 500 close down 1.6%. This marks the 20th time this year that the index has declined by 1% or more in a single day.
Here’s the table:
Let's break down what the table shows:
The first column represents the year, while each subsequent column indicates the number of large down days for that year, ranging by declines of 1%, 2%, and 3% or more and total count.
The Takeaway: That’s the 20th time this year it has fallen by 1% or more in a single day.
It sounds like a lot, but it’s not unusual. Since 1950, the average year has about 25 of these moves. So we’re still below that.
Still, 20 is a good point to pause and ask: Is this normal volatility, or something more?
If there were real fear, we’d likely see huge spikes in the VIX or credit spreads. So far, we haven’t.
Volatility is part of any market, even in strong years. But price tells the story. A few isolated drops don’t mean much. A cluster of them might.
If we start seeing five or six of these in a short time, that could signal a shift in trend.
So what should traders do? Watch support levels. Pay attention to how stocks react around those spots. And don’t overreact to one red day.
This may be noise. Or it may be the start of something more. We’ll know soon enough.
Grant Hawkridge | Chief Aussie Operator, All Star Charts
PS. If you’re new to options or just tired of feeling stuck, this one’s for you. Join Jason Perz, Sean McLaughlin, and special guest Joe Duarte live this Thursday at 2:30 pm Eastern as they walk through the biggest pitfalls that crush traders — and how to sidestep them with real-world strategy. Join them here and trade smarter.
If you find my content valuable, I would greatly appreciate it if you could share it with your friends, family, and colleagues. Your help in spreading the word is invaluable in supporting our work. Thank you to all of you who share!