Anyways, it is on my mind because Batnick brought up the Dollar Tree chart and I’ve been watching it ever since. We both really like the setup.
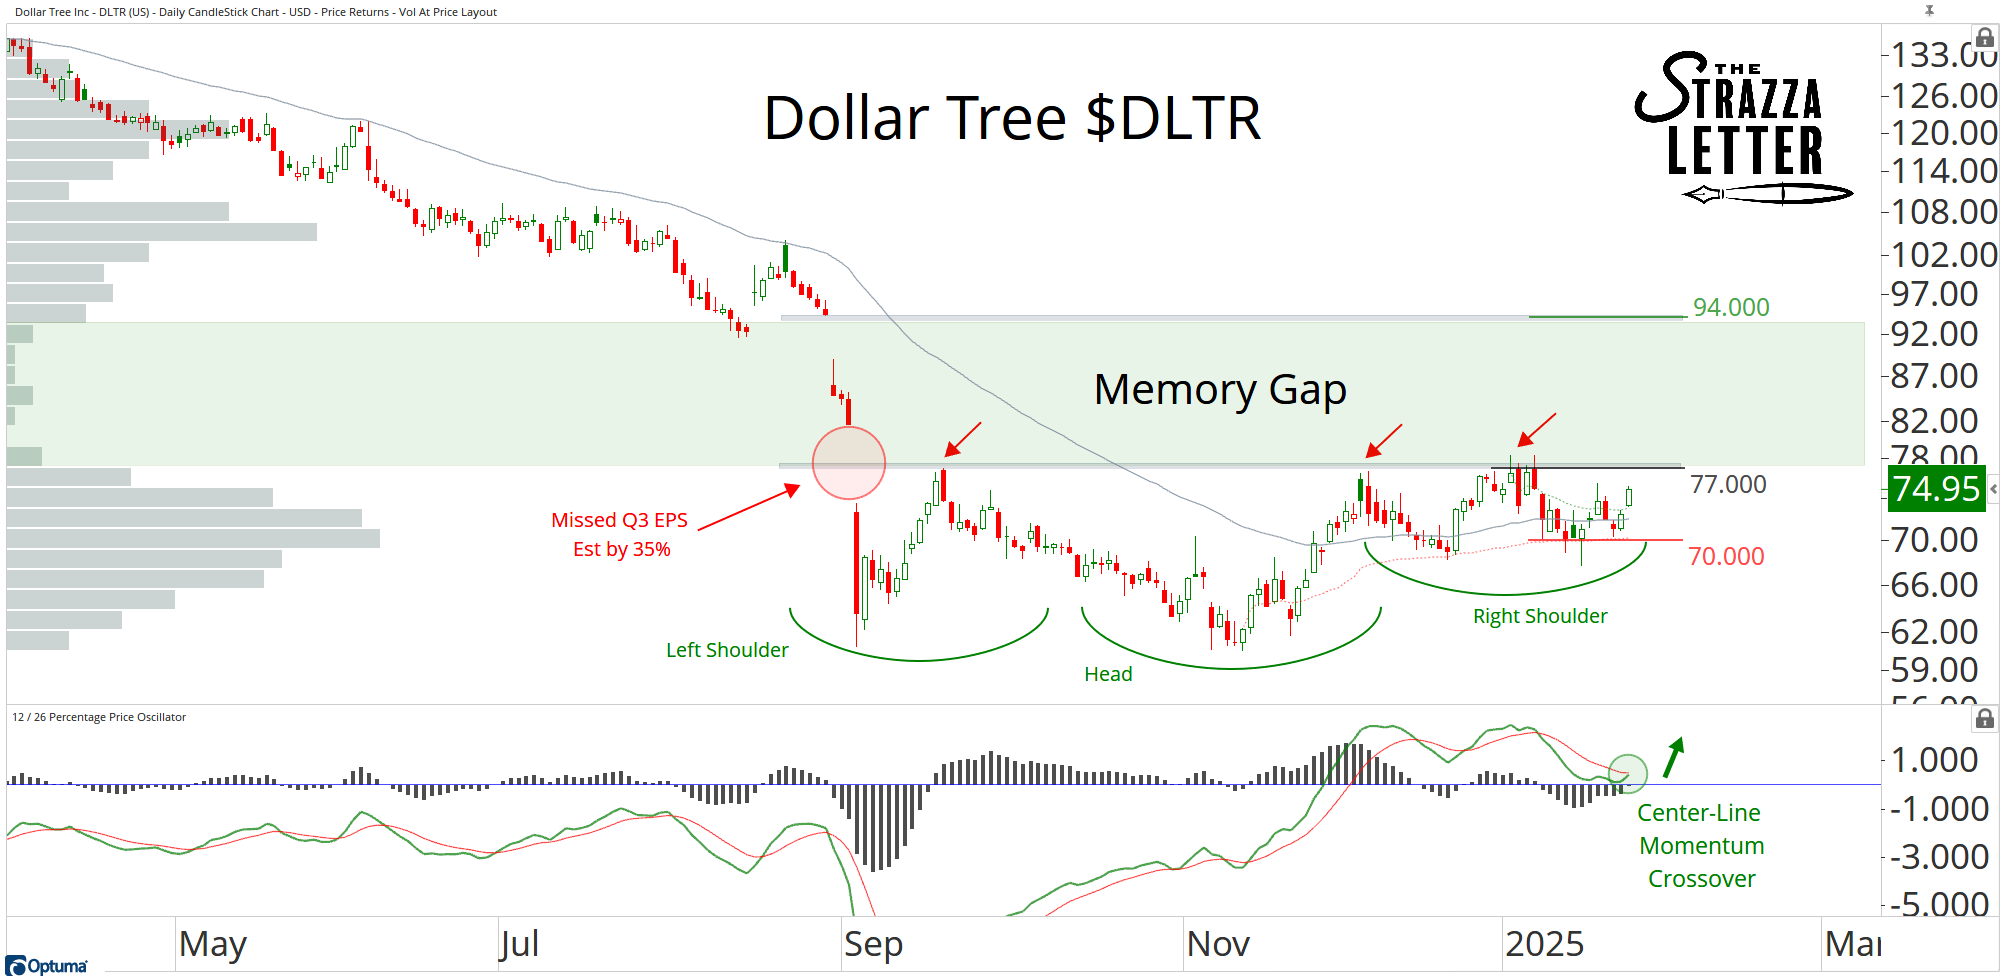
Today, I’m pulling the trigger as it looks to be finishing the right shoulder of this inverse head and shoulders pattern:
But, that’s not all this DLTR setup is offering us as traders. What really has me interested is the massive memory gap that comes into play just north of the base breakout level.
You can see this gap illustrated by the volume at price indicator shown in bar chart format on the left of the screen. All it means is that buyers and sellers barely transacted at these levels. Notice how the stock only traded here for a handful of days while it was collapsing on the heels of an earnings miss last year.
We want to think about these memory gaps or volume pockets in the same way we think about any other price gap.
These zones are likely to get filled, and when they do, momentum is likely to accelerate.
Sometimes price cuts through these zones like a knife through butter. Other times, they don’t work as well.
Considering the duration of the base in play, and the center-line momentum crossover printing on the daily chart, I think odds favor a fast move for DLTR once it enters the gap.
Here’s how I’m trading it.
First of all, I’m jumping the entry.
It’s a bull market, and price is above all short and intermediate-term VWAPs and moving averages.
The lower boundary of the memory gap is governed by the pivot highs around 77. That’s the real breakout level, but I’ll be using it as confirmation.
The upper bounds of the zone is about 94.
My stop is at the pivot lows around 70 which is also the VWAP from the November lows (red dotted line). All these levels are shown in the chart.
At today’s price, this trade results in about 26% upside to the target and I’m risking 5% to my stop. That’s a little better than a 5x risk/reward. It’s plenty good for me. I think it can happen fast too.