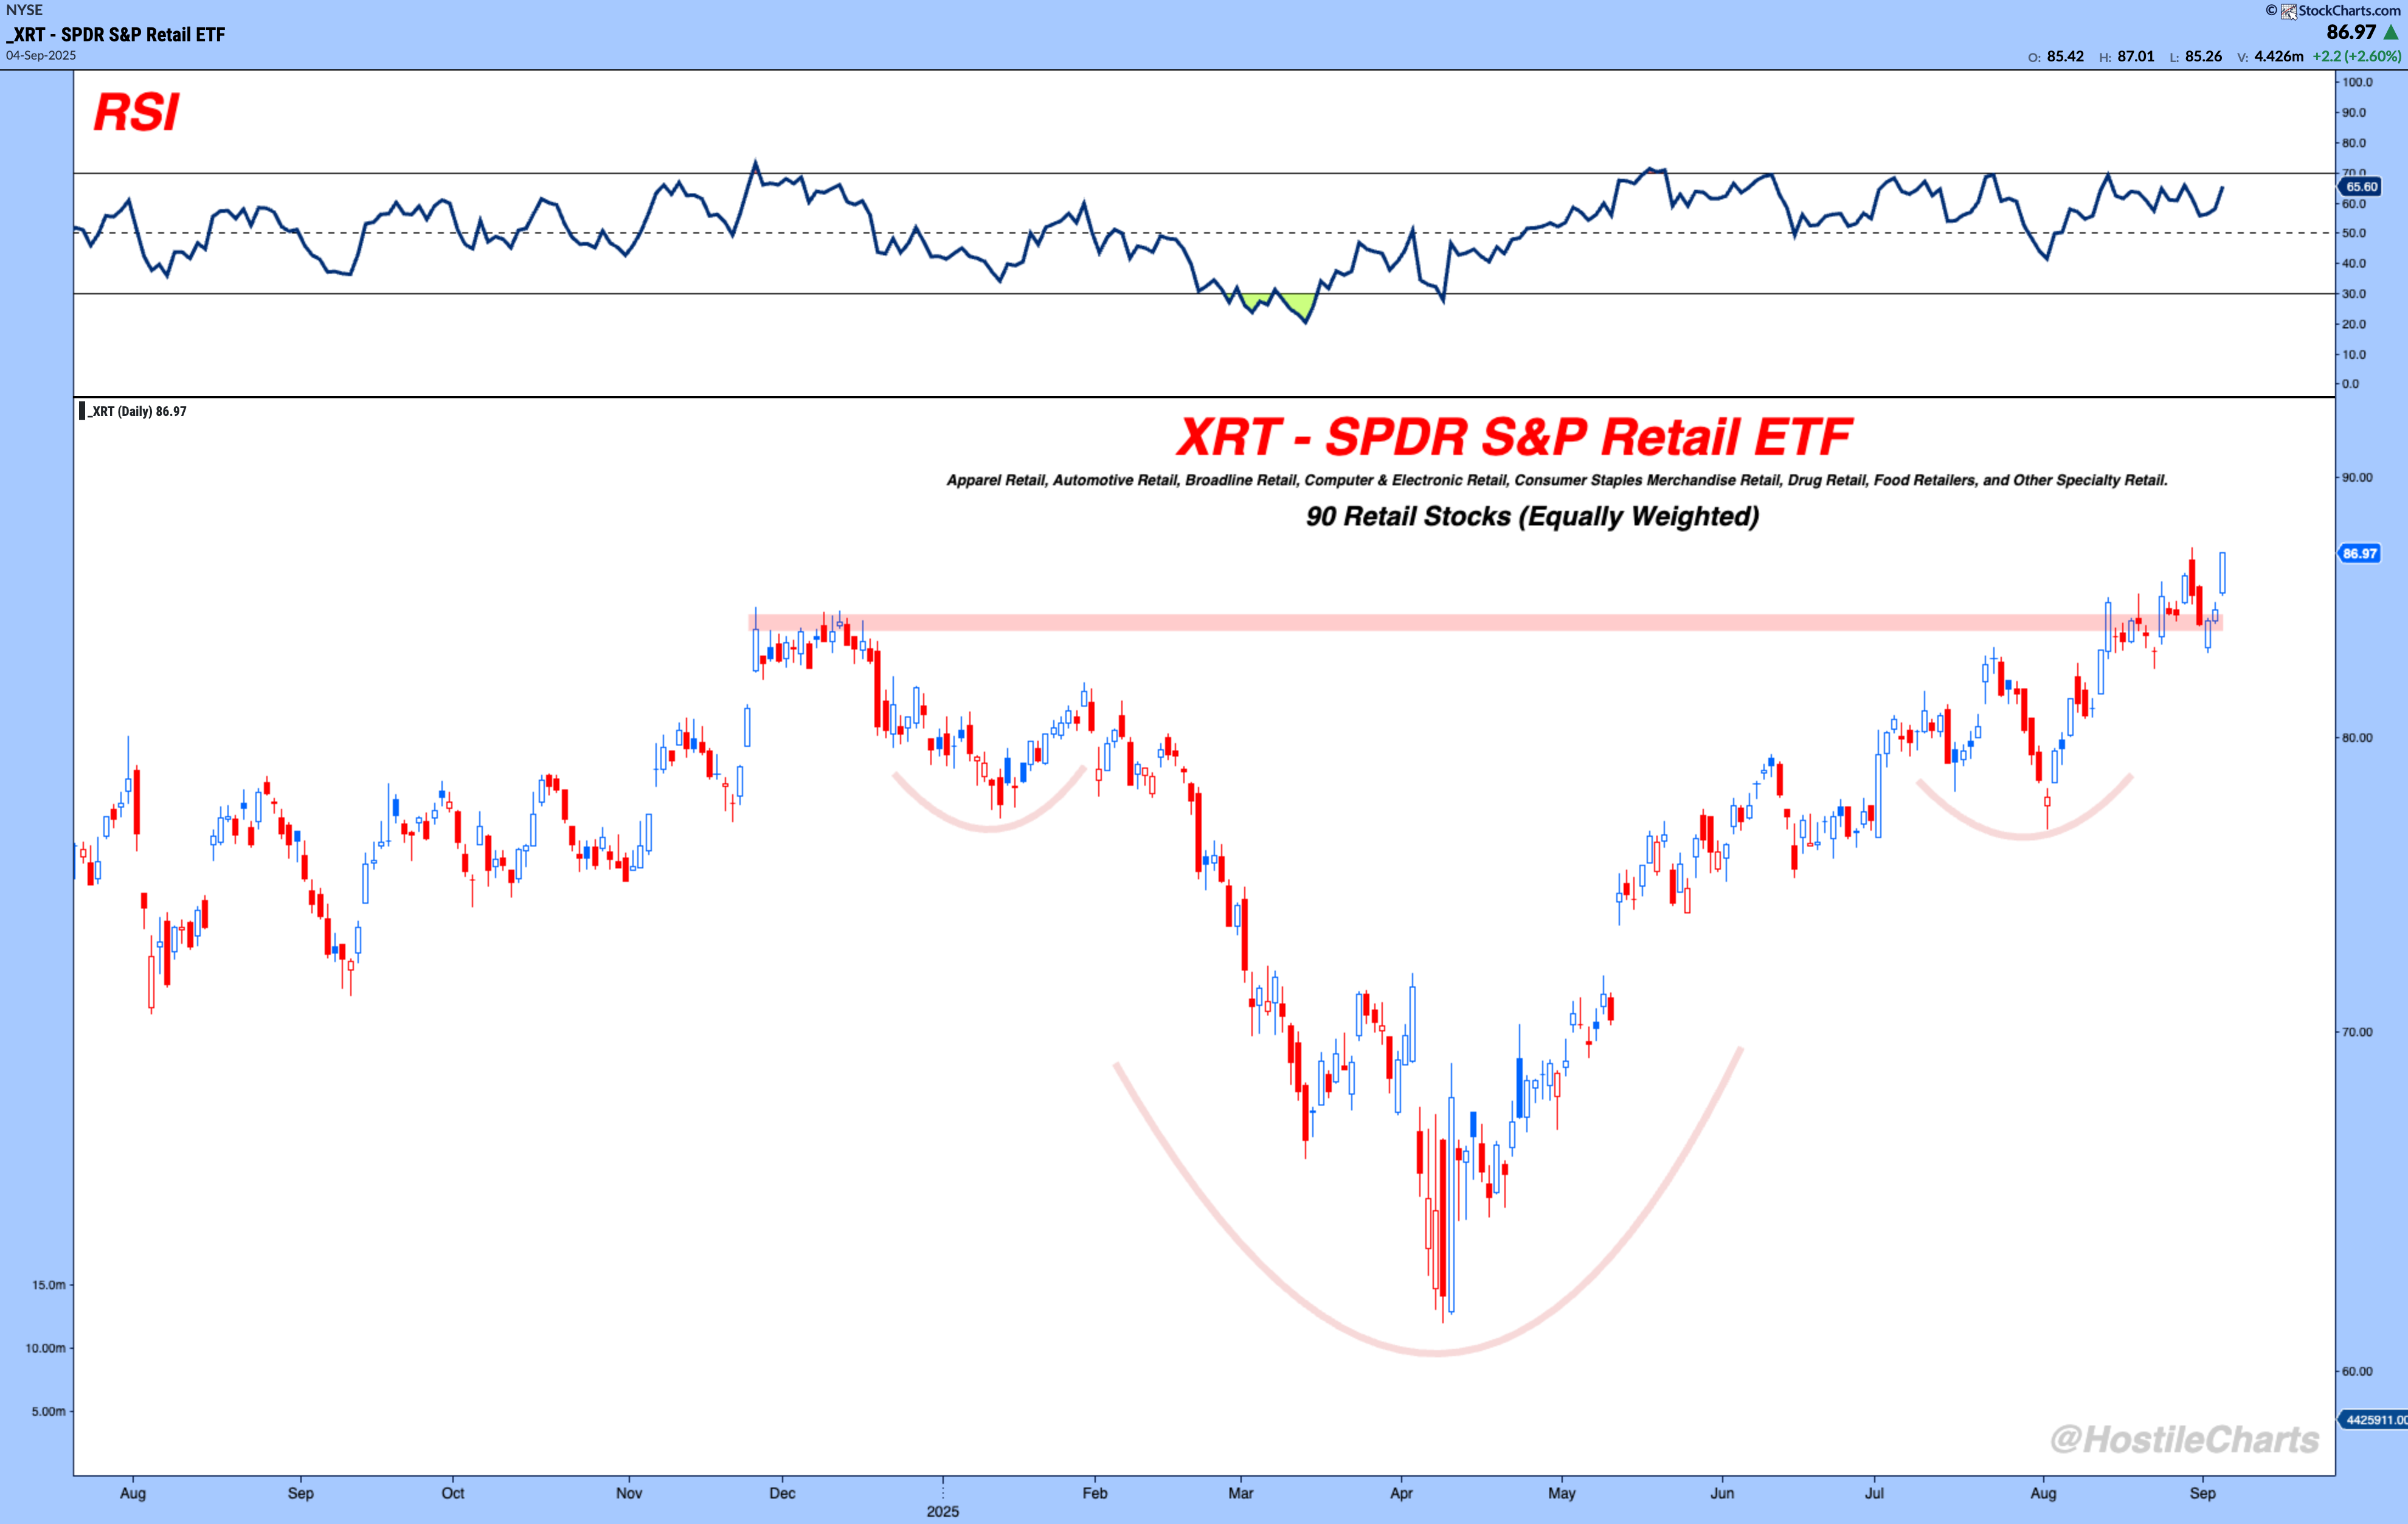
Larry Thompson The Retail "Vibes" Chart This One Chart Tells 90 Stories September 4, 2025 I’ll keep it quick since NFL kickoff is around the corner.One of the best parts about technicals is they let us quantify the vibes.We get to analyze the collective wisdom of the market instead of relying on the faulty nature of human emotions.Every day you see people trying to turn their trip to the mall or the beach into an investment thesis on the consumer. It’s fun conversation, but it’s not a process.With technicals, we don’t have to guess. We can test whether the “vibes” are the rule or just the exception.Take retail for example. $XRT an ETF of about 90 retail names, equally weighted, just closed at multi-year highs...TODAY. We’re talking companies like Kohl’s, Tractor Supply, eBay, AutoZone, Dick’s Sporting Goods, Ulta Beauty, Walmart and dozens more.This one chart tells 90 stories. It quantifies every anecdote - the store your uncle complains about being too busy, and the one your cousin swears is dead, into a single vote.And right now, price is telling us the "vibes" are pretty good.Leave the storytelling for Thanksgiving. Let price lead your investing.Anyways, that’s my two cents. Filed Under: $XRT Share Article