The market bottomed in April and hasn’t looked back.
The V-shape recovery scenario is playing out — and stocks are delivering across the board.
We saw the signs early — momentum thrusts, rotation into risk-on areas like tech and industrials, international expansion.
These things made us confident we’d seen a valid reversal.
And now we’re seeing the natural next step: continuation patterns breaking out.
Most are taking the shape of flags these days.
Flag patterns are brief consolidations that form after sharp moves. Price pauses and coils in a tight range, often drifting slightly lower or sideways.
It’s a controlled pullback —a healthy digestion of gains before a resumption in the trend..
The key is the steep move that comes before the flag. That’s what creates the setup, and it’s what sets the target.
Once price breaks out of the flag, we typically see a measured move equal to the size of the prior leg.
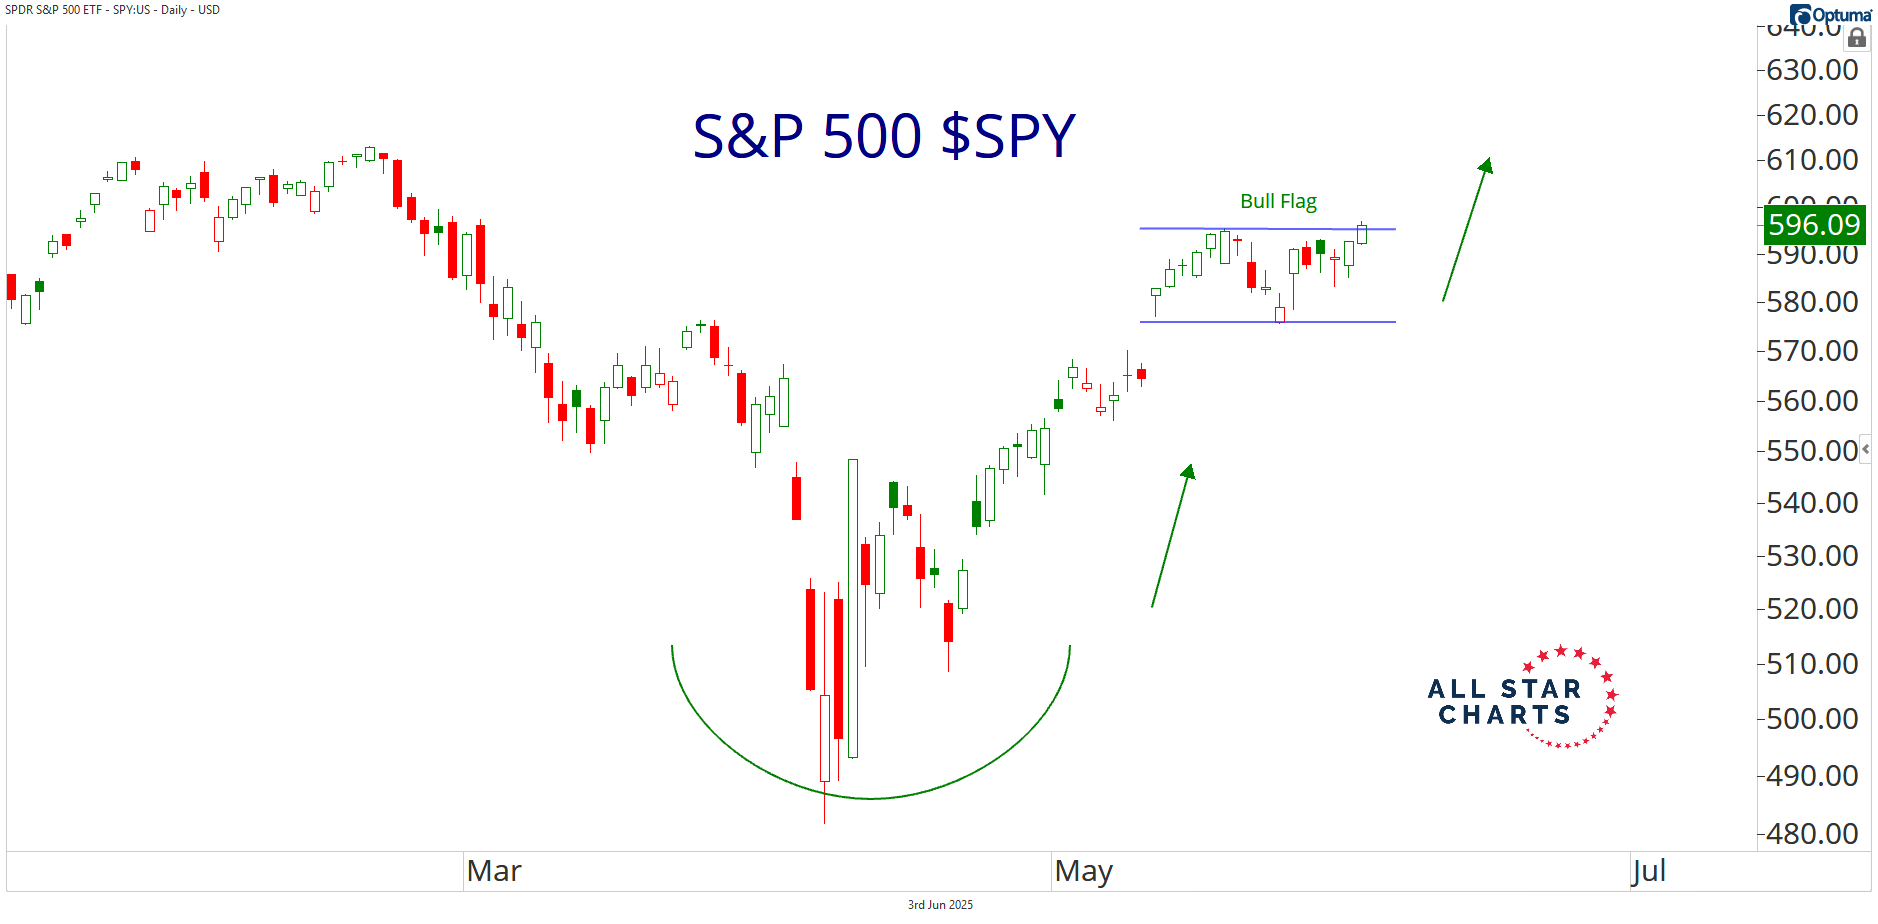
The S&P 500 is a textbook example.
A high and tight flag — and now we’re breaking out.
Measuring the flagpole off the April lows gives us a target of ~700.
I laughed to myself when I calculated it because it feels like a big move. But this is textbook technical analysis, and while it doesn’t mean the S&P will move to 700 like a magnet from here, it can only be interpreted as bullish.
If this resolution is valid, we should all be prepared for a test of the all time highs.
And it’s not just the S&P — we’re seeing this look across major indexes, sectors and individual equities.
We just bet on some bull flags in $MU and $C. These tight coils look like they’re breaking higher as we speak.