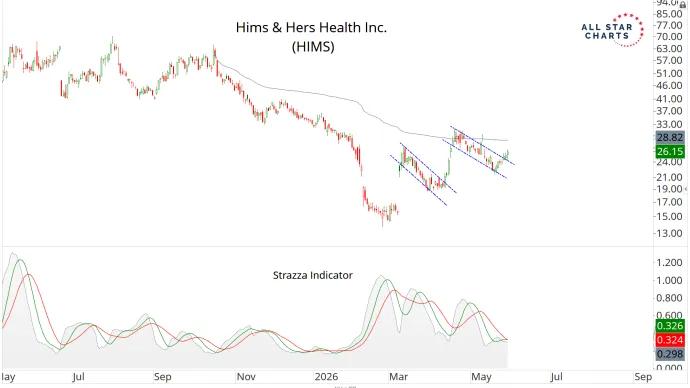
The GLP-1 boom is the biggest pharma story of the decade. Ozempic and Wegovy can now be ordered from a telehealth app on a monthly subscription. After Novo Nordisk threatened to sue over...
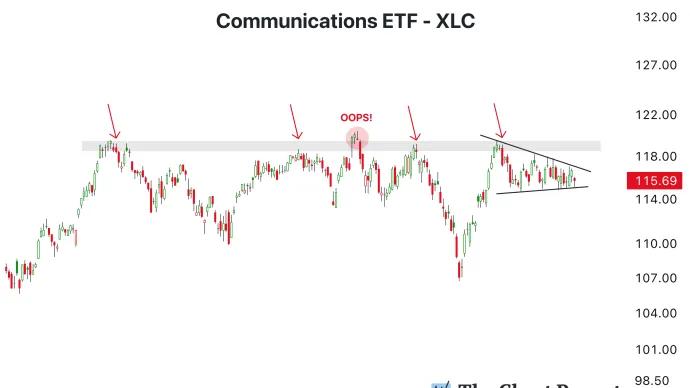
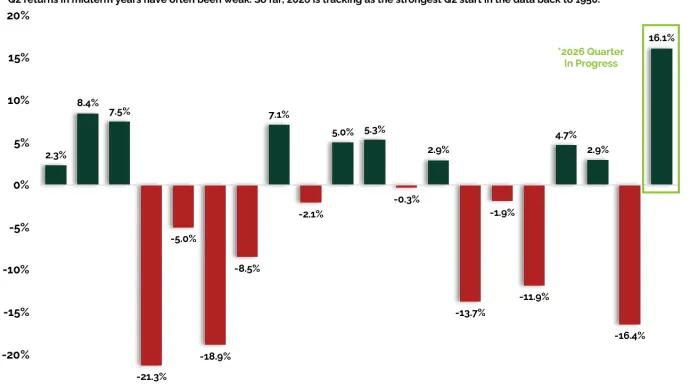
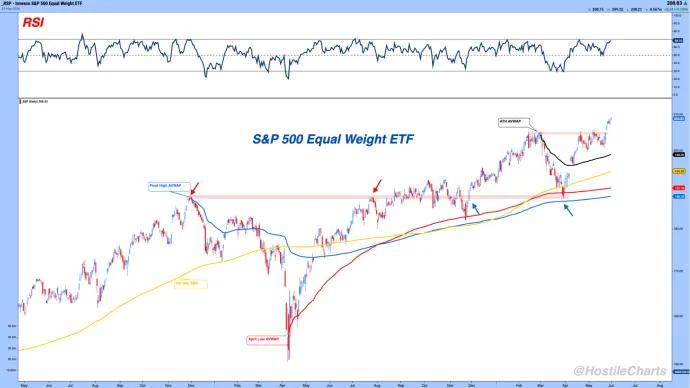
The market just delivered the strongest start to a midterm-year Q2 in the data going back to 1950. That's happening during a period that is supposed to be one of the toughest stretches of the entire...