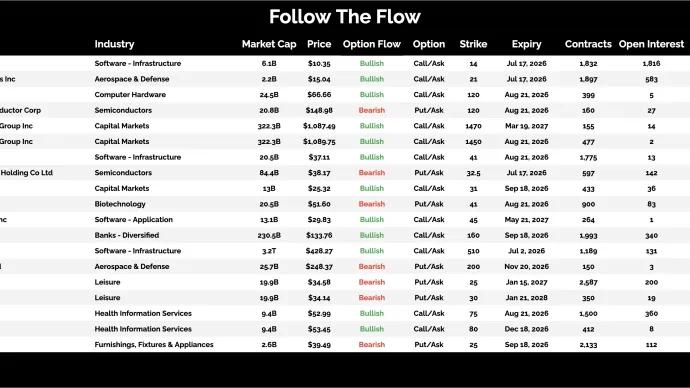
Every day, we sift through the filings to spot where the real conviction lies – cutting through the noise to highlight the most meaningful insider moves.
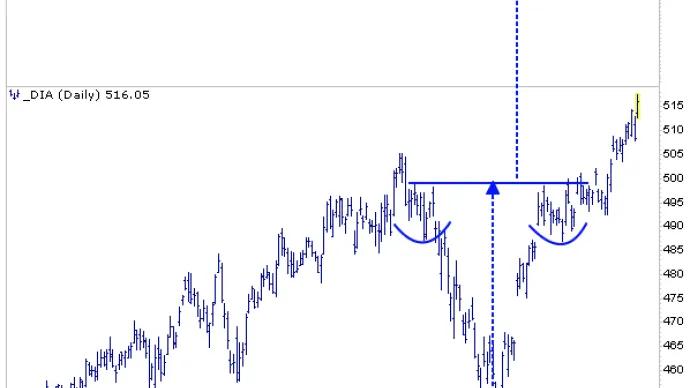
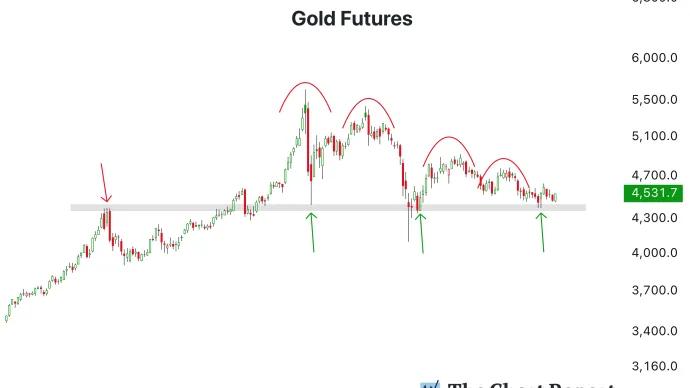
It isn't all sunshine and rainbows when riding trends. Sometimes, it's all blue skies overhead. Then a sudden wind out of the north catches you by surprise, and before you know it, you and your stock position have...
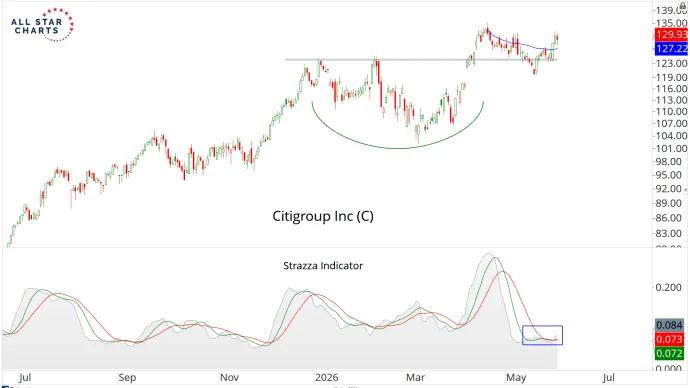
Wall Street's longest-running laggard just flipped to one of the cycle’s bank leaders. The stock is up over 70% in the past year, beating out many of the big 6 banks. Today's standout...
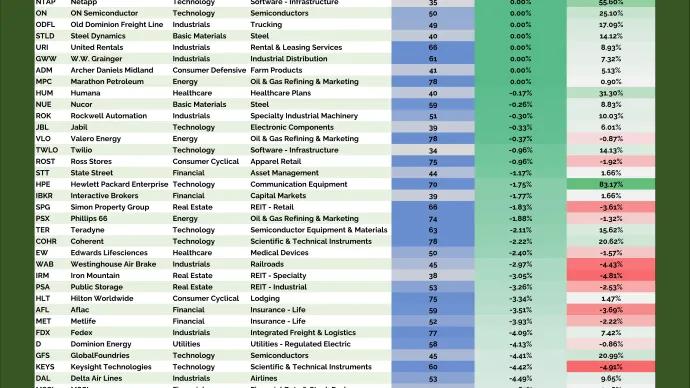
We love our bottoms-up scans here at All Star Charts. We tend to get really creative when making new universes as we want to be sure they will deliver us the best opportunities the market has to...
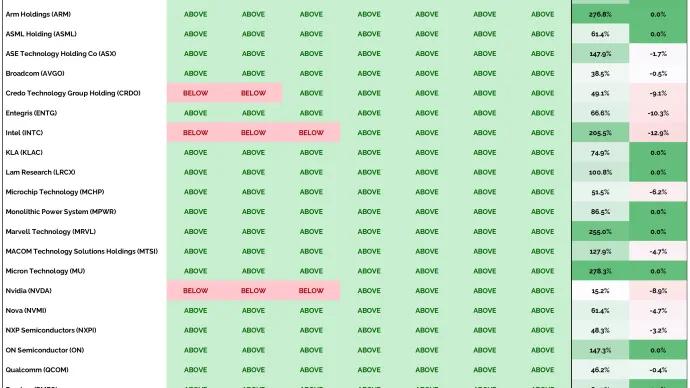
Semiconductors have become the market's undisputed leadership group. The Semiconductor ETF (SOXX) has soared 104.4% so far in 2026, more than doubling while much of Wall Street...