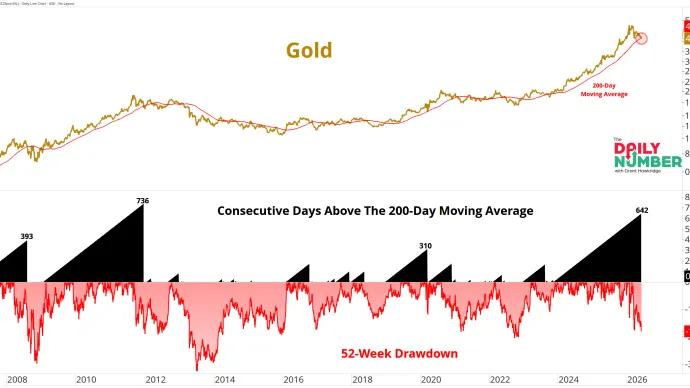
Gold finally lost its footing. After spending 642 consecutive trading days above its 200-day moving average, the metal has now broken below that key trend...
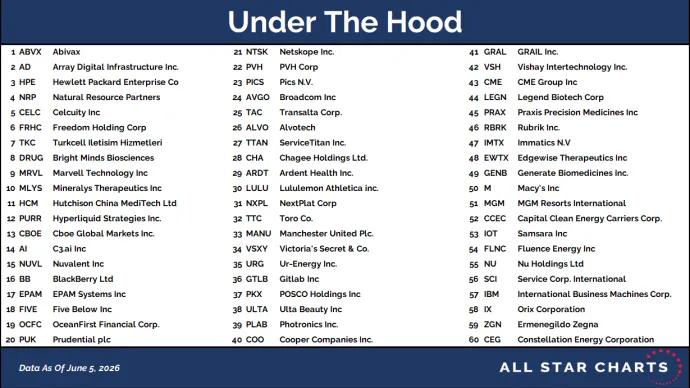
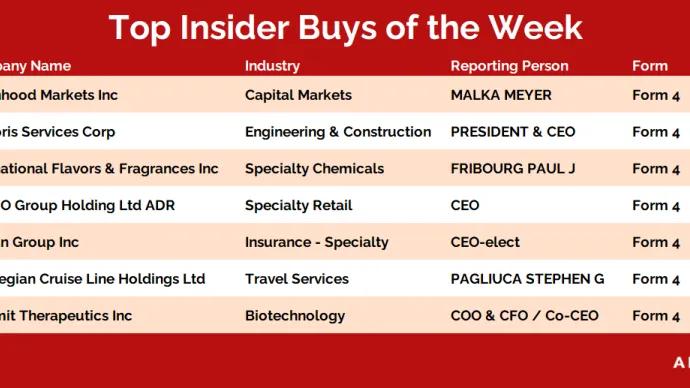
Every day, we sift through the filings to spot where the real conviction lies – cutting through the noise to highlight the most meaningful insider moves.
Welcome to The Squeeze Watch.Healthcare just hit a 25-year low versus the S&P 500. The ratio is now testing the same level that preceded the sector's bottom in 2000, a logical zone for a bounce.
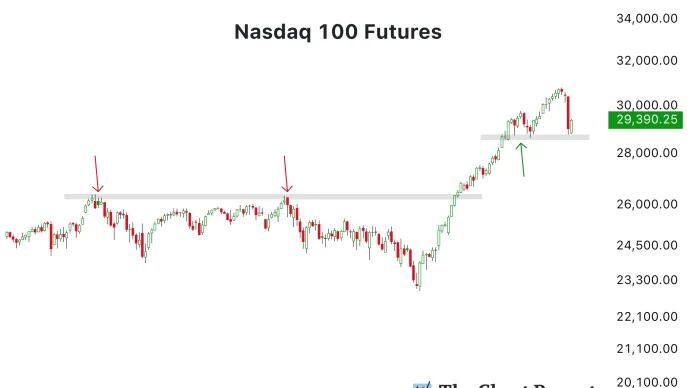
Two broken charts faced the same test, but only one passed.
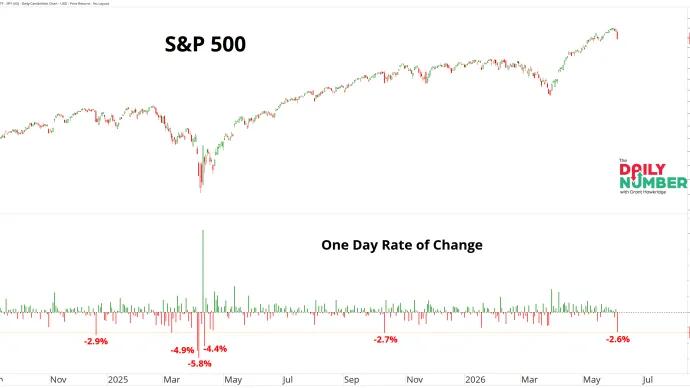
On Friday, the broader market finally took a punch, with the S&P 500 suffering its worst session since October and snapping a nine-week winning streak.
But beneath that index-level volatility, the earnings tape gave us a cleaner and...
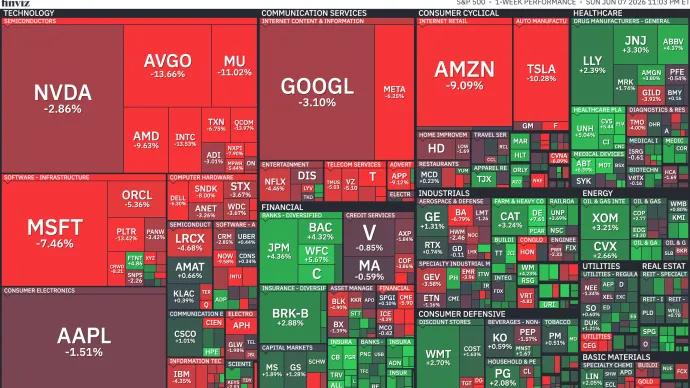
The market's biggest winners finally got hit. Technology stocks led the selloff as the S&P 500 fell 2.6% on Friday, its first decline of 2% or more in 93 trading days.
Every weekend, I dig into our filings tracker looking for the biggest conviction buys — and this week, the standout theme was deep-pocketed insiders and longtime shareholders stepping up in size.