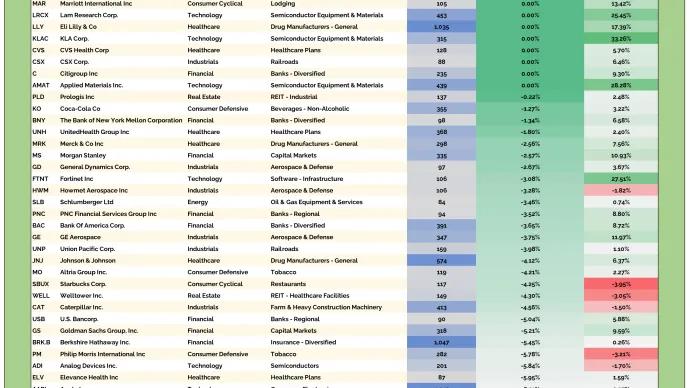
These stocks failed their earnings tests as weak charts and bad sentiment kept sellers in control.
The mainstream was locked in on SpaceX Friday, and for good reason.
The largest IPO in market history is an event that deserves attention. When a company that important goes public, every investor on the planet wants to know what it means for...
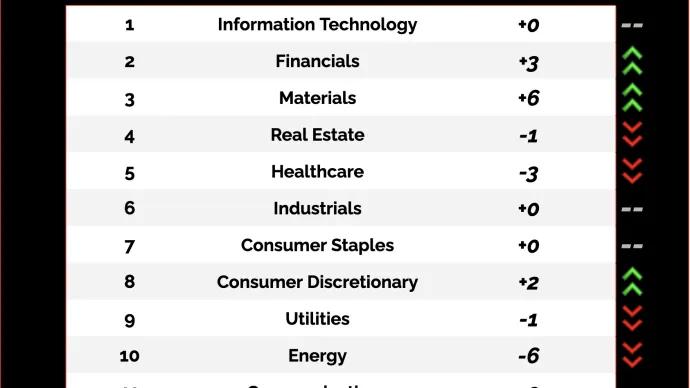
Earnings season is fading, but these reports could still tell us a lot about risk appetite and sector rotation.
WHAT ARE YOUR THOUGHTS? On Friday, SpaceX $SPCX completed the largest IPO in market history. It closed with a total market capitalization of $2.1 trillion.
Do you think SPCX will hit a market capitalization of $1 trillion or $4...
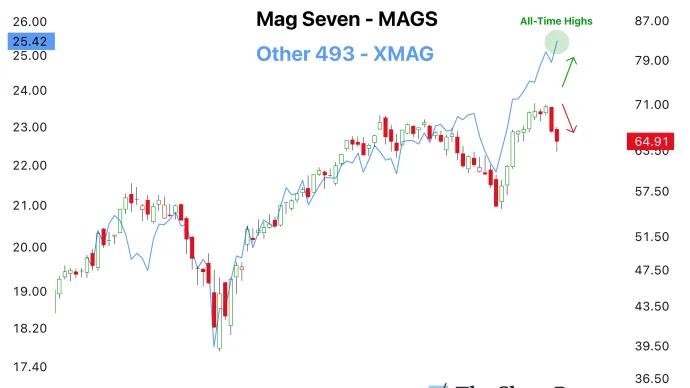
SpaceX just completed one of the largest IPOs in market history, and now we’re focused on the stocks that can benefit from the next wave of risk appetite.
Love the game. Love myself. Love others. Profits are a byproduct of how well I can do these three things successfully.
Hello again, Spirit Animals.
This started as a private entry in my journal, but then midway through it I thought you fine readers might get some benefit out of it as well. So I finished my thoughts here...