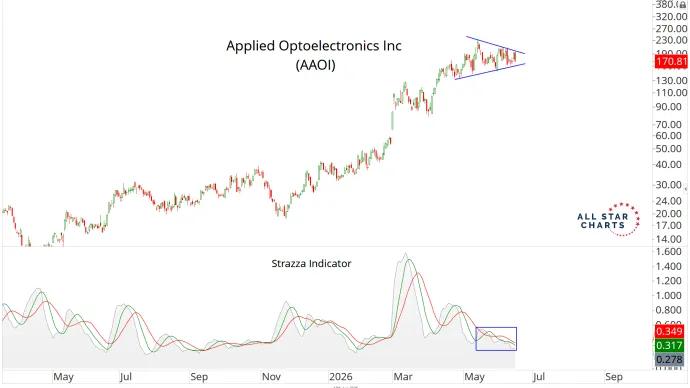
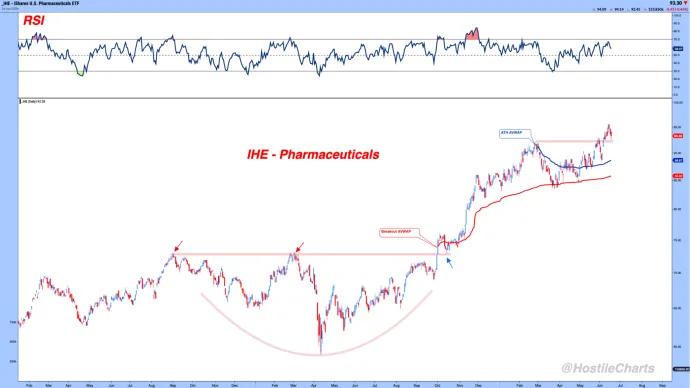
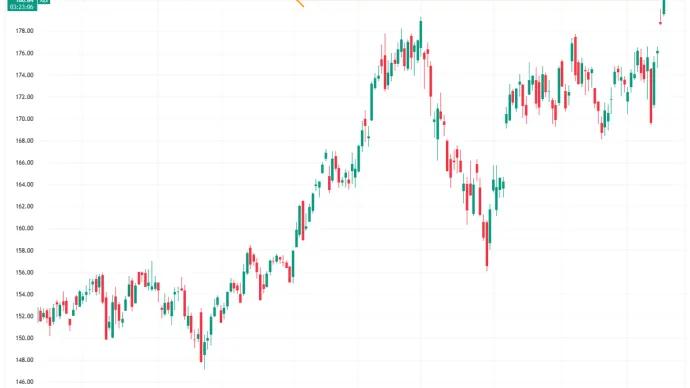
Today's trade is in a name that once treated me very well. Since then, it built a solid base. It recently had a fake breakout, but has since retraced back to the highs. That feels very bullish to me.
Me and All Star Options subscribers had been riding a calendar spread in $ROKU options for the past few weeks. And when the stock started ripping Friday afternoon, it looked like...
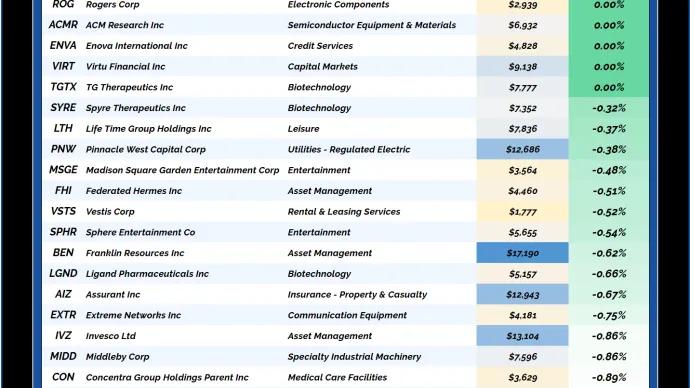
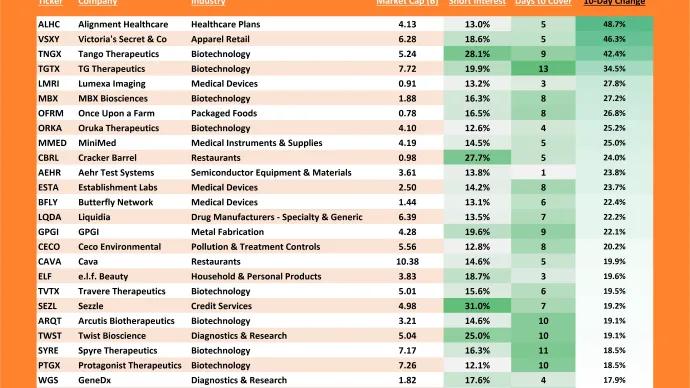
Every day, we sift through the filings to spot where the real conviction lies – cutting through the noise to highlight the most meaningful insider moves.