Ignore gloomy headlines during the Dog Days of Summer
Markets and, by extension, the entire country are taking a breather after a frantic month of Knicks, White House UFC fights, War, Peace and about 50 different earnings releases from consumer companies of every stripe. With my son working as...
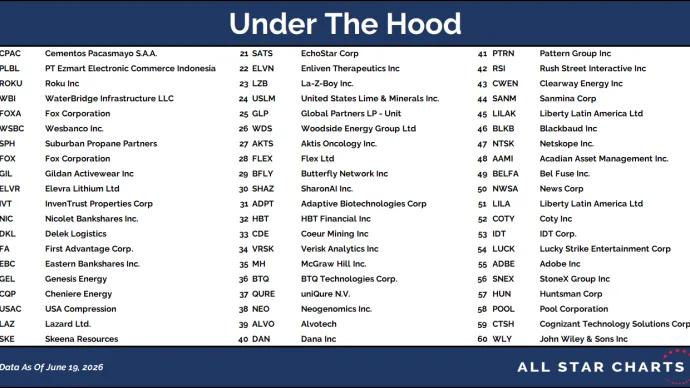
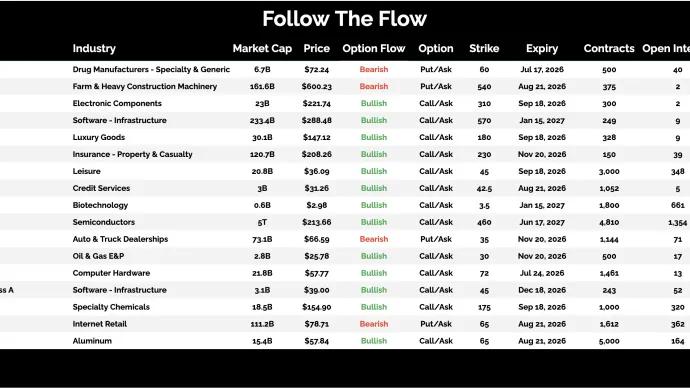
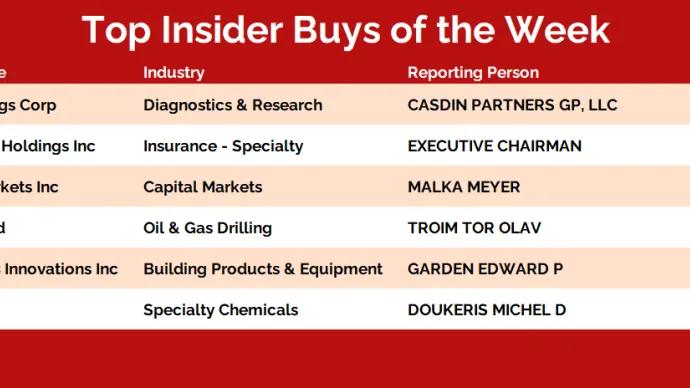
Every weekend, I dig into our filings tracker looking for the biggest conviction buys — and this week, there were some major moves from founders, executives, and strategic shareholders.