Every day, we sift through the filings to spot where the real conviction lies – cutting through the noise to highlight the most meaningful insider moves.
Dividend Aristocrats are easily some of the most desirable investments on Wall Street. These are the names that have increased dividends for at least 25 years, providing steadily...
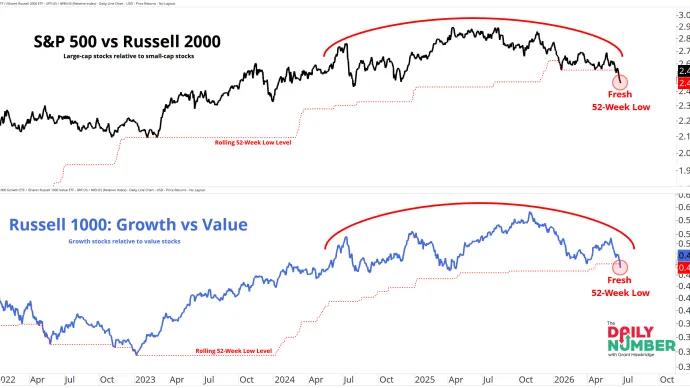
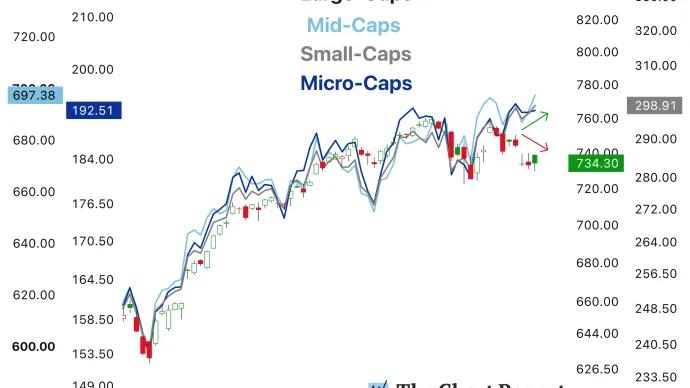
There's more to the stock market than Semiconductors.
Hello again, Spirit Animals.
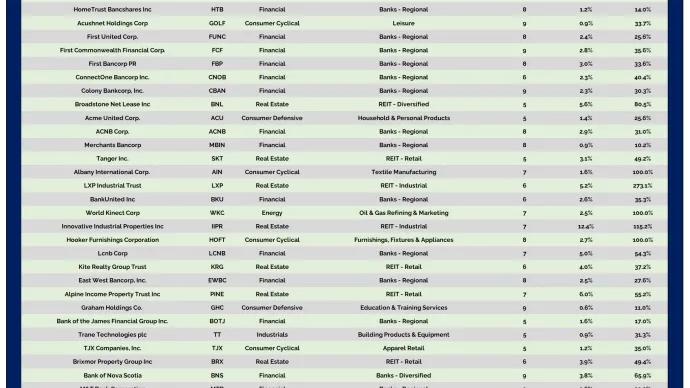
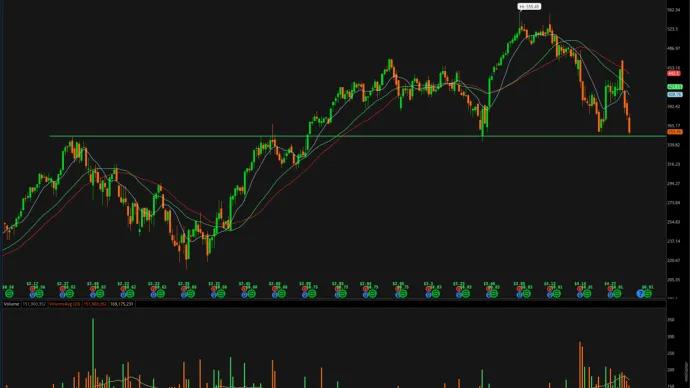
As I surf around the stock market looking at charts, I can't help but notice that new 52-week and All-Time highs are popping in all kinds of sectors. This is breadth. And it's what is healthy for the long-term...