It took 120 trading days for the Dow Jones US Software Index to claw its way back and close at a fresh all-time high.
Here’s the chart:
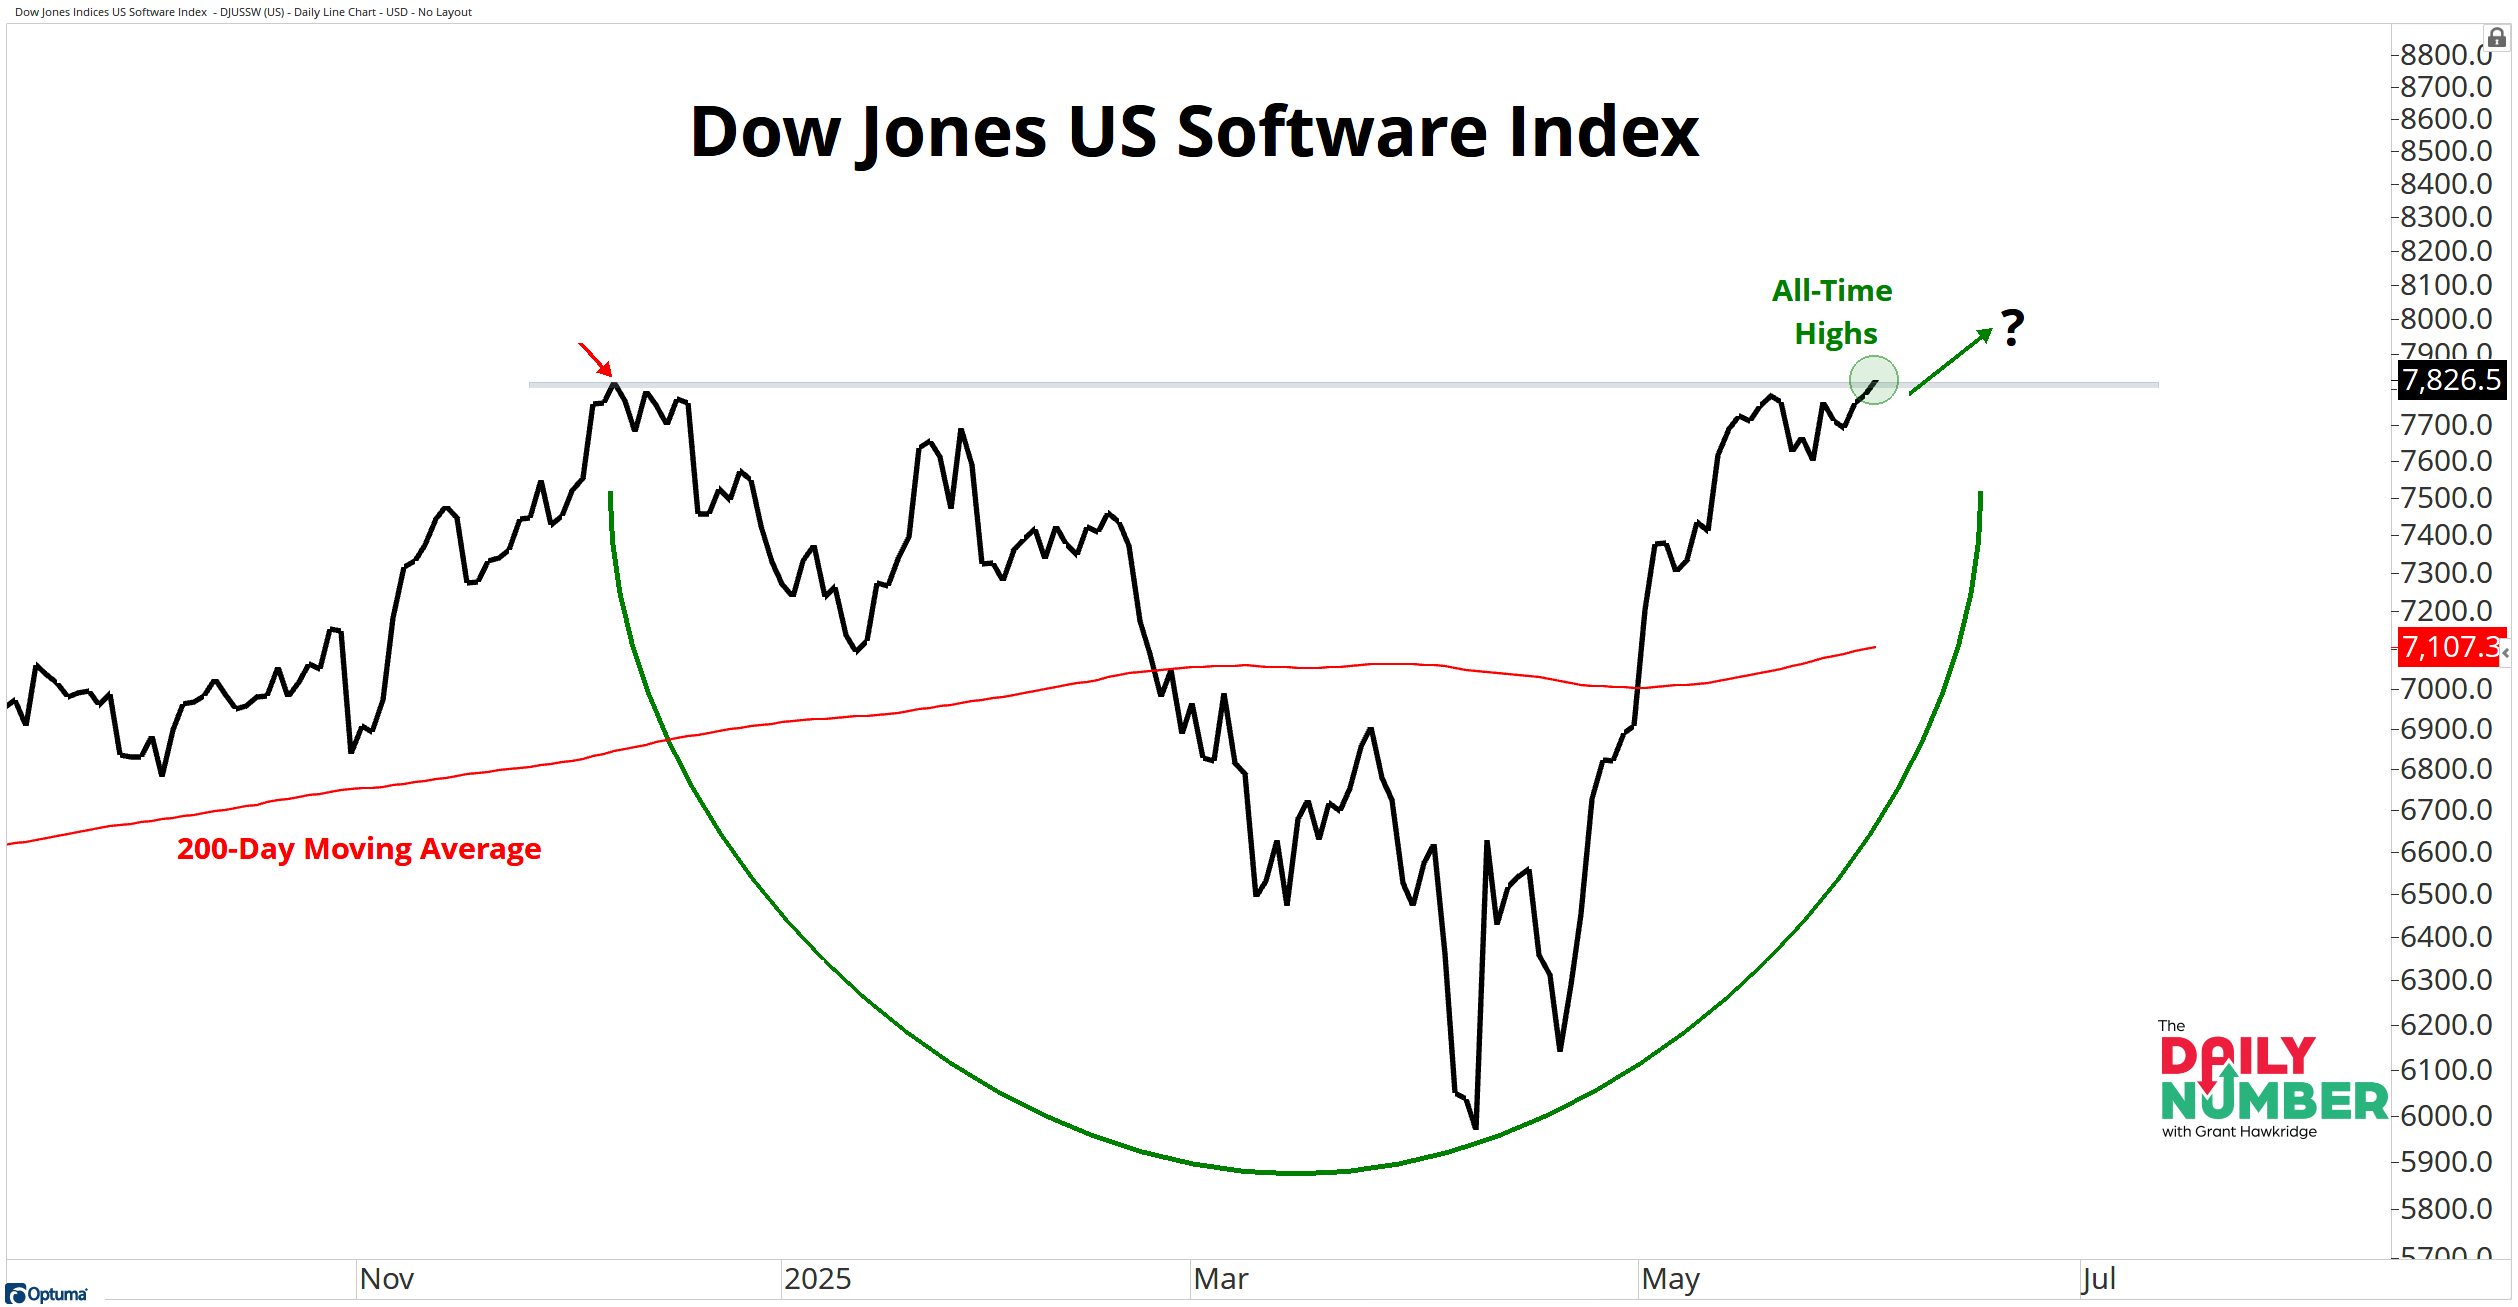
Let's break down what the chart shows:
The black line shows the price of the Dow Jones US Software Index.
The Takeaway: The Dow Jones U.S. Software Index just closed at a fresh all-time high.
Software stocks have been stuck for months. For nearly half a year, the index chopped sideways after falling more than 23% from its December 2024 peak.
After 120 trading days of going nowhere, the index has returned to where it left off, and now it looks ready for the next move higher.
When software stocks lead, it tells us investors are taking on more risk. They’re putting money to work in growth and innovation again.
This doesn’t happen in weak markets.
And this isn’t being driven by small speculative names.
Microsoft, the second-largest stock in the S&P 500 with a $3.4 trillion market cap, is less than 1% away from all-time highs.
Intuit, worth $213 billion, closed just 0.04% below its peak.
These are major names.
Big money follows them.
So, if software keeps pushing higher, other parts of the growth trade should follow.
That includes semis, cloud, and even small-cap tech.
All of these industries benefit when risk appetite returns.
Will this strength spill over into the rest of tech — or is this just a software solo act?
Grant Hawkridge | Chief Aussie Operator, All Star Charts
Need a full trading toolkit that actually helps you make moves? All Star Charts Premium gives you daily trade ideas, proprietary scans, and access to our entire analyst team. If you're serious about leveling up your strategy,start here.
If you find my content valuable, I would greatly appreciate it if you could share it with your friends, family, and colleagues. Your help in spreading the word is invaluable in supporting our work. Thank you to all of you who share!