Steve Strazza Visa Pays Us June 29, 2026 Wave Trader Members Only Search Displaying 73 - 96 of 22725 Steve Strazza Staples Step Up June 24, 2026 Breakout Multiplier Breakout Blog Members Only The Squeeze Watch (06/24/2026) Welcome to The Squeeze Watch.Biotech has quietly become one of the strongest groups in the market, and the rotation is still picking up steam. Beaten-down names that spent years in the wilderness are catching real... June 24, 2026 Breakout Multiplier Squeeze Watch Squeeze Watch Kenny Glick If you’re missing $CBRS, you need me We’re not just day trading. We’re extracting. Hit The Bid Members Only Alfonso De Pablos, CMT I'm Buying the Spiciest Biotech Stocks One of the things I always pay attention to is where the market is rewarding risk and where money is actually flowing.Lately, one of the clearest answers has been biotech.It's a theme I've been steadily... June 24, 2026 Alfonso's Daily Note ASC Alfonso Grant Hawkridge Something Doesn't Add Up Here ⚠️ Today's number is… 5The market just triggered a signal that has only appeared five times over the past 23 years.Here’s the chart: Let's break down what the chart shows:... June 24, 2026 The Daily Number Grant 🔎 Biotechnology Hits All Time Highs It could be one of the greatest beneficiaries of AI. June 24, 2026 ETF Power Rankings Donovan Jackson Fear Is Back at Resistance 🌤️ The Morning Print June 23, 2026 The Morning Print The Morning Print $NDX Steve Strazza MARA's Second Act June 23, 2026 Wave Trader Surf Report Members Only Steve Strazza A Quantum Coil June 23, 2026 Breakout Multiplier Breakout Blog Members Only Steve Strazza The Daily Flow Big bets just landed on waste infrastructure,computer hardware, and genomics, each one directional, each one sized for a move. This note highlights a select group of stocks showing the most unusual — and highly directional — options activity.The goal is simple: follow the big money and trade in the direction of the underlying... June 23, 2026 All Star Charts Premium ASC Follow The Flow Steve Strazza Sam Gatlin Jason Perz The Dollar's Problem For the last few weeks, investors have been asking whether the recent dollar strength marks the beginning of a larger move higher.Maybe.But if we’re going to get a sustained bull market in the dollar, one thing probably needs to happen... June 23, 2026 Supercycle Stocks supercycle stocks Donovan Jackson Semis Are Running Out of Steam 📉 The Chart Report June 23, 2026 The Chart Report Front Top Content Featured Stories Daily Chart Report Alfonso De Pablos, CMT Hot Corner Insider Weekly Strategy Session - June 23, 2026 Here are the video and the chartbook for the Hot Corner Insider Weekly Strategy Session. June 23, 2026 Hot Corner Insider Video Members Only Steve Strazza Wave Trader Weekly Strategy Session - June 23, 2026 Below is the stream of the Weekly Strategy Session for members of Wave Trader. June 23, 2026 Wave Trader Video Members Only Kenny Glick Four 10-point trades on the same stock SpaceX just gave us the trade of a lifetime June 23, 2026 Hit the Bid With Kenny Glick Sam Gatlin Jason Perz Making Money From The Sun This trade could go 10x for us. June 23, 2026 Supercycle Report Special Reports Members Only Steve Strazza The Beat Report Best Ideas Meeting - June 19, 2026 SMTV Portfolio Education Members Only Sean McLaughlin This Glass Isn't Broken Markets are slippery this morning and some leaders are enduring some well deserved pullbacks.I'm going to take advantage of today's sale prices and high volatility to position into one of these leaders. June 23, 2026 All Star Options Options Options Premium Members Only Alfonso De Pablos, CMT Avocados, Mangos, & Telehealth Every day, we sift through the filings to spot where the real conviction lies – cutting through the noise to highlight the most meaningful insider moves.📌 Mission Produce $AVO — Bruce C. Taylor... June 23, 2026 The Hot Corner Insider Buys Spencer Israel The Morning Show Slide Deck - June 23, 2026 Every day, our team assembles a slide deck of charts to discuss on The Morning Show. Sometimes we get to all of them, sometimes not. But either way, they're valuable. As members of the Stock Market TV... June 23, 2026 SMTV Portfolio Members Only The Consumer Credit Boom Since April, this stock has rallied nearly 200% because of it. Yesterday, we wrote about Victoria’s Secret $VSXY.And today, we’re staying with the consumer, but we’re moving from lingerie to lending.That... June 23, 2026 Daily Beat $SEZL Sam Gatlin Jason Perz SCR Buy Alert: Adding To Our Tanker Exposure This stock has a massive reversal pattern, a fat dividend, and low-volume above. June 23, 2026 Supercycle Report Trade Alert Members Only Steve Strazza Ricardo Sarraf The Short Report From the Desk of Steve Strazza @SstrazzaWhen investing in the stock market, we always want to approach it as "a market of stocks."Regardless of the environment, there are always stocks showing... June 23, 2026 All Star Charts Premium Short Report ASC Premium Ricardo Members Only Kenny Glick Glick’s Picks: The Kardashian bottom on SpaceX We couldn't have traded this better June 23, 2026 Glick's Picks $QQQ $SPCX $NOK Members Only Pagination Back Page 1 Page 2 Page 3 Page 4 Page 5 Page 6 Page 7 Page 8 Page 9 … 947 Next Recent Episodes You Request The Ticker, We Break It Down. June 29, 2026 The Morning Show The Morning Show June 29, 2026 June 29, 2026 Hosted by Spencer Israel JC Parets Steve Strazza With special guest(s) Kenny Glick John Netto Grant Hawkridge Thompson's Two Cents Thompson's Two Cents Live! June 26, 2026 Hosted by Larry Thompson The Long And Short Of It with Kenny Glick June 26th, 2026 June 26, 2026 Hosted by Kenny Glick Options Jam Session Options Strategy Deep Dive: What Traders Need to Know June 25, 2026 Hosted by Sean McLaughlin Supercycle Stocks Live Supercycle Report Live! June 25, 2026 Hosted by Jason Perz Sam Gatlin Missed it? No problem!Replays of all our past episodes are always available in the episode archives. View Episode Archives
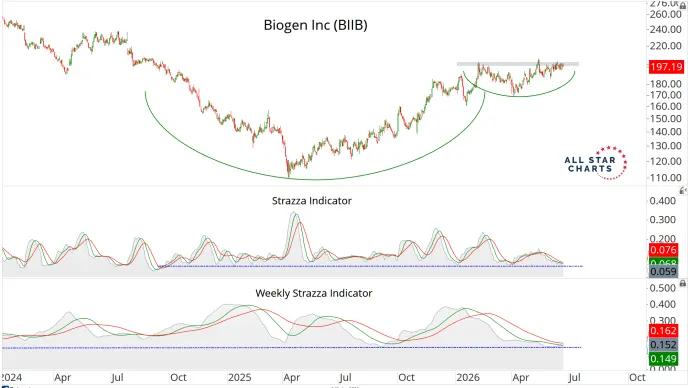
The Squeeze Watch (06/24/2026) Welcome to The Squeeze Watch.Biotech has quietly become one of the strongest groups in the market, and the rotation is still picking up steam. Beaten-down names that spent years in the wilderness are catching real... June 24, 2026 Breakout Multiplier Squeeze Watch Squeeze Watch
Kenny Glick If you’re missing $CBRS, you need me We’re not just day trading. We’re extracting. Hit The Bid Members Only
Alfonso De Pablos, CMT I'm Buying the Spiciest Biotech Stocks One of the things I always pay attention to is where the market is rewarding risk and where money is actually flowing.Lately, one of the clearest answers has been biotech.It's a theme I've been steadily... June 24, 2026 Alfonso's Daily Note ASC Alfonso
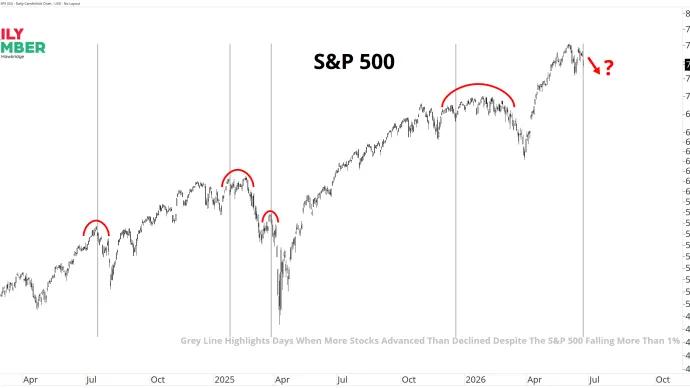
Grant Hawkridge Something Doesn't Add Up Here ⚠️ Today's number is… 5The market just triggered a signal that has only appeared five times over the past 23 years.Here’s the chart: Let's break down what the chart shows:... June 24, 2026 The Daily Number Grant
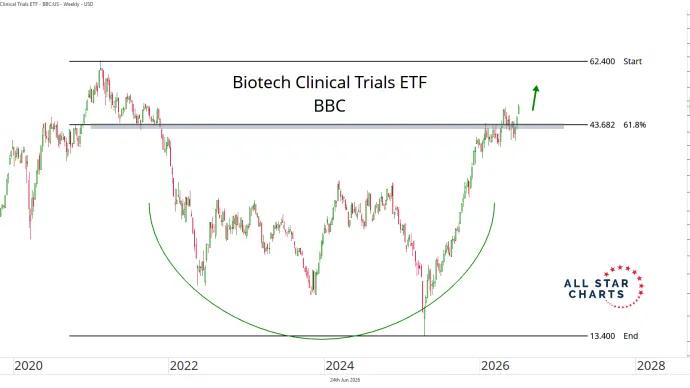
🔎 Biotechnology Hits All Time Highs It could be one of the greatest beneficiaries of AI. June 24, 2026 ETF Power Rankings
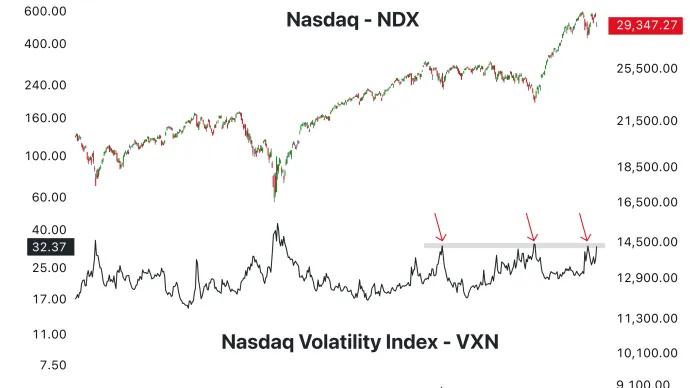
Donovan Jackson Fear Is Back at Resistance 🌤️ The Morning Print June 23, 2026 The Morning Print The Morning Print $NDX
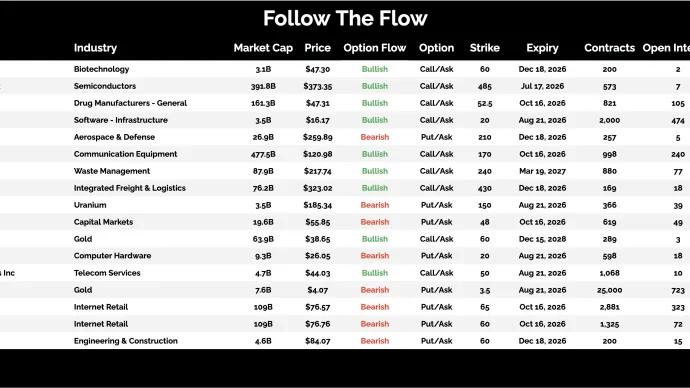
Steve Strazza The Daily Flow Big bets just landed on waste infrastructure,computer hardware, and genomics, each one directional, each one sized for a move. This note highlights a select group of stocks showing the most unusual — and highly directional — options activity.The goal is simple: follow the big money and trade in the direction of the underlying... June 23, 2026 All Star Charts Premium ASC Follow The Flow Steve Strazza
Sam Gatlin Jason Perz The Dollar's Problem For the last few weeks, investors have been asking whether the recent dollar strength marks the beginning of a larger move higher.Maybe.But if we’re going to get a sustained bull market in the dollar, one thing probably needs to happen... June 23, 2026 Supercycle Stocks supercycle stocks
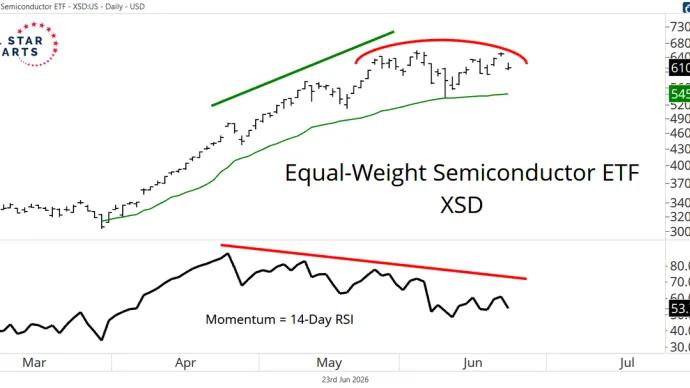
Donovan Jackson Semis Are Running Out of Steam 📉 The Chart Report June 23, 2026 The Chart Report Front Top Content Featured Stories Daily Chart Report
Alfonso De Pablos, CMT Hot Corner Insider Weekly Strategy Session - June 23, 2026 Here are the video and the chartbook for the Hot Corner Insider Weekly Strategy Session. June 23, 2026 Hot Corner Insider Video Members Only
Steve Strazza Wave Trader Weekly Strategy Session - June 23, 2026 Below is the stream of the Weekly Strategy Session for members of Wave Trader. June 23, 2026 Wave Trader Video Members Only
Kenny Glick Four 10-point trades on the same stock SpaceX just gave us the trade of a lifetime June 23, 2026 Hit the Bid With Kenny Glick
Sam Gatlin Jason Perz Making Money From The Sun This trade could go 10x for us. June 23, 2026 Supercycle Report Special Reports Members Only
Steve Strazza The Beat Report Best Ideas Meeting - June 19, 2026 SMTV Portfolio Education Members Only
Sean McLaughlin This Glass Isn't Broken Markets are slippery this morning and some leaders are enduring some well deserved pullbacks.I'm going to take advantage of today's sale prices and high volatility to position into one of these leaders. June 23, 2026 All Star Options Options Options Premium Members Only
Alfonso De Pablos, CMT Avocados, Mangos, & Telehealth Every day, we sift through the filings to spot where the real conviction lies – cutting through the noise to highlight the most meaningful insider moves.📌 Mission Produce $AVO — Bruce C. Taylor... June 23, 2026 The Hot Corner Insider Buys
Spencer Israel The Morning Show Slide Deck - June 23, 2026 Every day, our team assembles a slide deck of charts to discuss on The Morning Show. Sometimes we get to all of them, sometimes not. But either way, they're valuable. As members of the Stock Market TV... June 23, 2026 SMTV Portfolio Members Only
The Consumer Credit Boom Since April, this stock has rallied nearly 200% because of it. Yesterday, we wrote about Victoria’s Secret $VSXY.And today, we’re staying with the consumer, but we’re moving from lingerie to lending.That... June 23, 2026 Daily Beat $SEZL
Sam Gatlin Jason Perz SCR Buy Alert: Adding To Our Tanker Exposure This stock has a massive reversal pattern, a fat dividend, and low-volume above. June 23, 2026 Supercycle Report Trade Alert Members Only
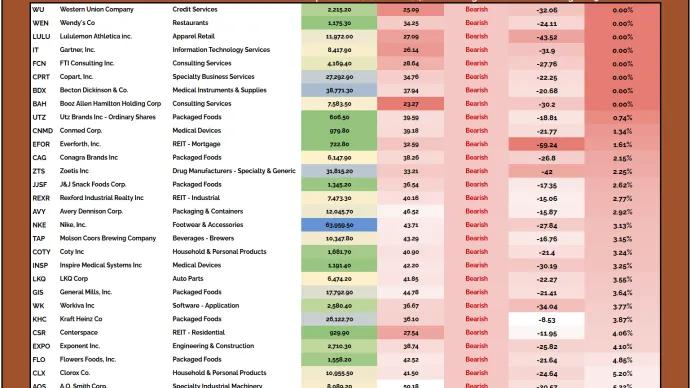
Steve Strazza Ricardo Sarraf The Short Report From the Desk of Steve Strazza @SstrazzaWhen investing in the stock market, we always want to approach it as "a market of stocks."Regardless of the environment, there are always stocks showing... June 23, 2026 All Star Charts Premium Short Report ASC Premium Ricardo Members Only
Kenny Glick Glick’s Picks: The Kardashian bottom on SpaceX We couldn't have traded this better June 23, 2026 Glick's Picks $QQQ $SPCX $NOK Members Only
The Morning Show The Morning Show June 29, 2026 June 29, 2026 Hosted by Spencer Israel JC Parets Steve Strazza With special guest(s) Kenny Glick John Netto Grant Hawkridge
Options Jam Session Options Strategy Deep Dive: What Traders Need to Know June 25, 2026 Hosted by Sean McLaughlin