Overnight, headlines hit the tape that the United States and Iran are preparing to formally sign an interim peace agreement that would reopen the Strait of Hormuz and begin a new round of nuclear negotiations.
Welcome to The Squeeze Watch.Everyone's talking about SpaceX.But most are missing what's happening underneath the surface.Rotation isn't just a headline story anymore. It's showing up in the charts.While the IPO grabbed all the attention,...
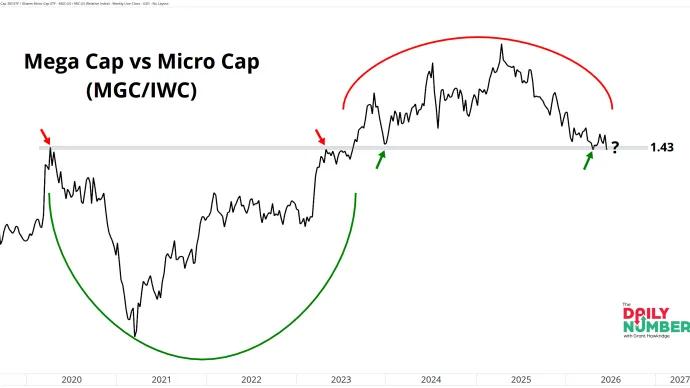
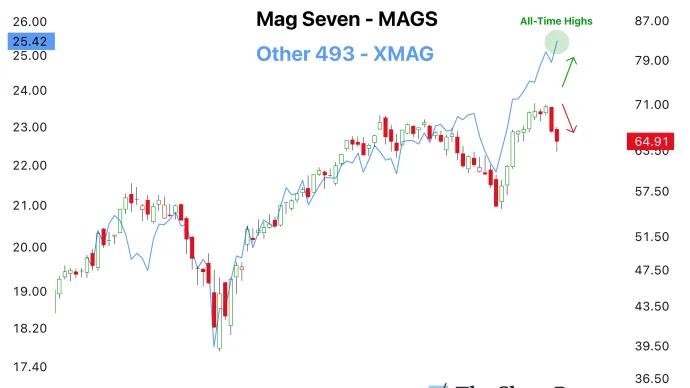
The ratio of Mega Cap stocks to Micro Cap stocks is sitting at 1.43. That's a level that has repeatedly acted as both support and resistance over the past six years.
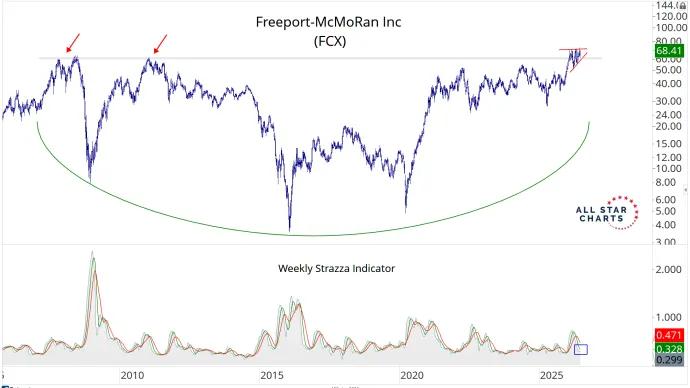
For years, investors have been conditioned to think about commodities through the lens of traditional demand. Housing needs copper. Cars need steel. Data centers need electricity. That’s all true.
Every day, we sift through the filings to spot where the real conviction lies – cutting through the noise to highlight the most meaningful insider moves.