Casey’s is using fuel to drive traffic and higher-margin food to drive one of the best trends in the market.
Casey’s General Stores $CASY is a convenience store chain based in Ankeny, Iowa, that offers fuel, pizza, snacks, coffee, energy drinks, groceries, and more.
They essentially provide everything you could need on your way home from work, before...
Every day, we sift through the filings to spot where the real conviction lies – cutting through the noise to highlight the most meaningful insider moves.
Once a week, I get together with Sean McLaughlin from All Star Options, and we're going to find an options trade to hunt for a new options trade for my Portfolio+ members. The goal is simple: utilize my expertise on the consumer and Sean's...
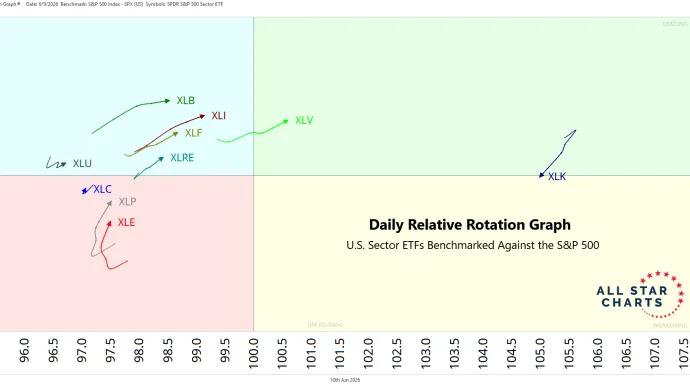
Welcome to The Squeeze Watch.The rotation no one's watching is starting in staples. The market chased AI and growth for 2 straight months while defensive and cyclical names sat the rally out. Here's a daily relative rotation graph showing...