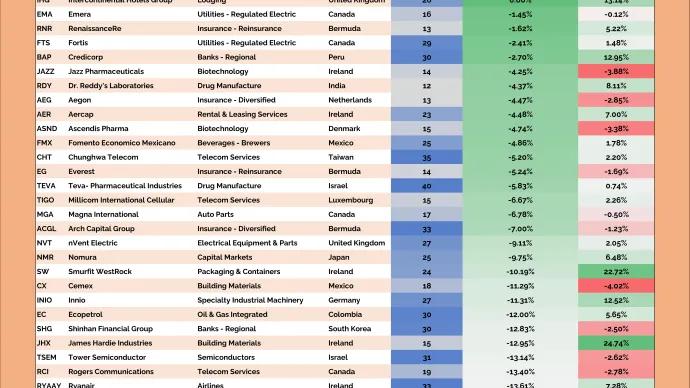
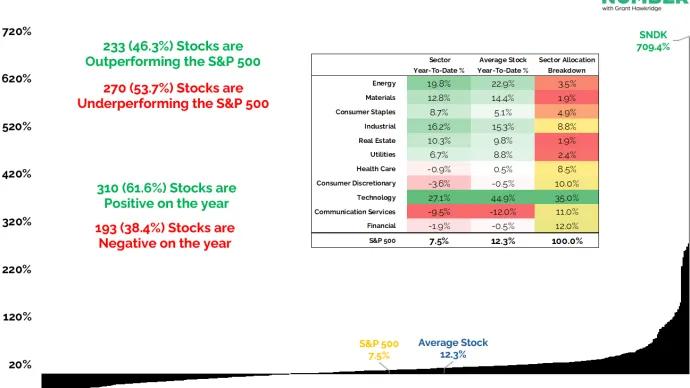
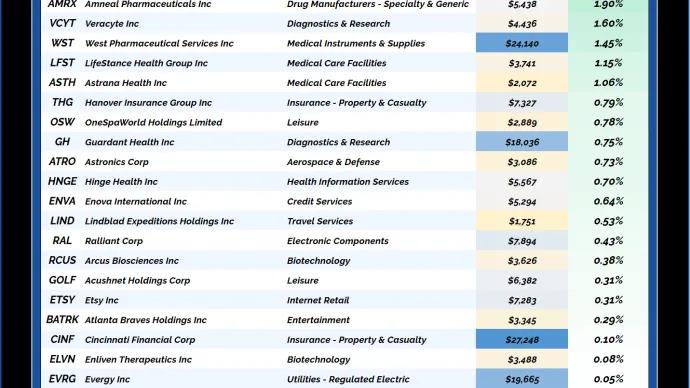
Displaying 49 - 72 of 17254

All Star Charts Gold Rush,
All Star Charts Premium

[Gold Rush] Short Sellers HATE This Play - Here's Why We're Loading Up 📈⚒️

April 14, 2025

Gold Miners are ripping in 2025 as Gold futures continue to print fresh all-time highs.

Here's how the year has played out so far:

  • The S&P 500 is down 8%
  • Bitcoin is down 9%
  • Bonds are flat
  • Silver is up 12%
  • Gold is up 22%
  • And Gold Miners are up 47%

There has been a tremendous amount of dispersion in the returns.

Despite precious metals' clear leadership role this year, the short sellers have piled into the Gold miners.

Short interest in the Gold Miners ETF $GDX is the highest in years. Here's why we think it's time for a squeeze: 🍊
All Star Charts Premium

Under The Hood (04-14-2025)

April 14, 2025

From the Desk of Steve Strazza @Sstrazza.

Welcome back to Under the Hood, where we'll cover all the action for the two weeks ended April 11th, 2025. This report is published bi-weekly, in rotation with The Minor Leaguers.

What we do here is analyze the most popular stocks during the week and find opportunities to either join in and ride these momentum names higher, or fade the crowd and bet against them.


We use a variety of sources to generate the list of most popular names.

There are so many new data sources available that all we need to do is organize and curate them in a way that shows us exactly what we want: a list of stocks that are seeing an unusual increase in investor interest.

Click here for a behind-the-scenes look at our process.

Whether we’re measuring increasing interest based on large institutional purchases, unusual options activity, or simply our proprietary lists of trending tickers, there’...

All Star Options

[Options] Shorter Timeframes for the Win

April 14, 2025

Since volatility picked up in early March, I’ve found that shorter-term trades have really started to shine.

Take a look at this snapshot of my recent trades in All Star Options:


With only a couple of exceptions, nearly every trade I’ve put on lately has had no more than two months until expiration—and the majority are even shorter than that.

Why?

Because when the market starts acting like it’s had too much coffee and not enough sleep, long-dated trades become harder to trust. Shorter-duration setups, on the other hand, let me be nimble. I can lean into fast-moving setups, take my profits (or manage risk quickly), and move on.

And it’s working.

These quicker-turn trades have noticeably increased my win rate and put some much-needed green back into the account—right when the broader market has been having a bit of a meltdown.

A few things to note in the above screenshot:

The green rows are completed trades that hit profit targets or closed with gains.

The red ones, obviously, are stop-outs for losses.

The white rows are still open positions—but most are...

All Star Options

[Options Premium] The $QQQ Campaign Continues

April 14, 2025

Since there seems to have been a bit of confusion about the $QQQ campaign that I embarked upon back on Wednesday, I'm creating a new post to help make new trades clearer for you all.

So far this AM, I've closed one of our put spreads at my profit target, and I'm adding a new one.

Options Paid to Play

[Options P2P] Daily Digest 4/14/25

April 14, 2025

In today’s Daily Digest, we’ll review the following:

  1. New position in TLT.
  2. No adjustments are needed today.
  3. No exits since the last report.
  4. Current status of open campaigns.
  5. Volatility Snapshot.

Let’s dig in!

Hot Corner Insider

Insiders Continue To Buy Across Sectors and Industries

April 14, 2025

Another day of notable purchases spans restaurants, airlines, and biotech. Meanwhile, we have fresh 13D and 13G filings in packaged foods and more.

📌 Cracker Barrel $CBRL

Bay Resource Partners put $2.43 million into the iconic restaurant chain, as shares trade at lows not seen since 2009. 

📌 Delta Air Lines $DAL

Director David S. Taylor disclosed a $601,174 purchase, a solid endorsement of the airline amid ongoing industry volatility.

Here’s The Hot Corner, with data from April 11, 2025:


Click the table to enlarge it.

📌 Viridian Therapeutics $VRDN

Commodore Capital LP filed a 13G revealing an increase in ownership from 3.03% to 5.30%. 

As the narratives regarding tariffs...

All About The Banks 🏦💸

April 14, 2025

We just heard from some of the largest financial institutions in the world, like JPMorgan Chase & Co. $JPM, BlackRock $BLK, and Wells Fargo & Co. $WFC.

3 out of 5 reported double beats, and 2 reported mixed results.

The market rewarded 4 out of 5 for their reports, but 3 out of 5 had negative reaction scores.

Jamie Dimon, one of the most powerful and influential financiers in the world, said the following about the current macro environment:

"The economy is facing considerable turbulence, with the potential positives of tax reform and deregulation and the potential negatives of tariffs and 'trade wars,' ongoing sticky inflation, high fiscal deficits, and still rather high asset prices and volatility."

In other words, he's not bullish...

Let's talk about what else happened with these reports.

Here are the latest earnings reports from the S&P 500 👇 

*Click the image to enlarge it

Fastenal $FAST had the best earnings reaction and reported mixed results with a reaction...

The Daily Number

The S&P 500 just experienced a Death Cross❌

April 14, 2025

Today's number is... 42nd

The 10-week moving average of the S&P 500 has fallen below the 40-week moving average for the 42nd time since 1950.

Here’s the chart:


Let's break down what the chart shows:

  • The black line is the S&P 500 index price.
  • The blue line is the 10-week moving average of the S&P 500 index price.
  • The red line is the 40-week moving average of the S&P 500 index price.
  • The gray lines highlight when the 10-week moving average crosses below the 40-week moving average - Also known as a Death Cross.
  • The table showcases the forward returns of the S&P 500 following a Death Cross.

The Takeaway: The trend is your friend until it bends, and the S&P 500 has been in an uptrend for the past 115 weeks.

But that changed last week when the S&P 500 experienced a Death Cross, which adds to the evidence in favor of Bears.

But what exactly is a Death Cross?

A Death Cross is a technical indicator that occurs when a short-term moving...

ETF Power Rankings Archives

🔎 Will Europe Keep Outperforming?

April 13, 2025
📊 Daily ETF Overview 

The prevailing theme on the international front has been the rotation taking place out of the United States and into a wider set of global markets.

We've seen significantly elevated volatility, and there's now a strong case to be made that the worse is behind us. Many key U.S. indexes have retested their 2021 highs and have firmly held.

Now the question has become - will international still outperform if risk markets recover from here?

A key chart to watch on this front is Europe $VGK versus the United States $VOO.


When this black line is going up, it means that Europe is outperforming the U.S. (as has been the case for a few months).

Right now, the ratio is at a key inflection point. If we see this ratio take out its most recent lows, it would indicate that money is rotating back into the United States.

The ratio will be a key chart to watch when understanding the leadership of the next bullish phase.

All Star Charts Premium

15 years in the making…

April 13, 2025

I have some personal news to share with you.

This announcement is 15 years in the making. And I’m grateful to all of you that I’m able to make it. 

Ladies and gentlemen, 2024 was my last year as Chief Market Strategist at All Star Charts Research.

Many of you were with me when I started writing a blog from my apartment in New York City in 2010. I was 28 years old then – just a kid trying to figure it out.

You were with me too when we turned the blog into a research company. We’ve added some of the top technicians in the game today to our team.

And All Star Charts is now one of the greatest technical analysis research companies in the history of the stock market.

I’m really proud of what we’ve built together. The team that I’ve assembled has helped me make decisions about what I do with my money for many years.

So I’m equally proud to share that Steve Strazza – my right-hand man and the Director of Research for the last five years – was named Chief Market Strategist at Allstarcharts earlier this year.

Steve has played an instrumental role in our success at All Star Charts. No single person on Earth is more qualified to take...

All Star Charts Premium

Bond Report: When the Plumbing Breaks, What Swap Spreads Are Telling Us

April 13, 2025

One of the most reliable signals of market stress isn’t in the headlines—it’s in swap spreads.

Swap spreads measure the difference between what banks pay to swap interest rates (SOFR) and what the U.S. government pays to borrow (Treasuries). When that spread collapses, like it just did, something’s breaking.

  • In 2008, swap spreads collapsed before Lehman.
  • In March 2020, they broke again when the Treasury market froze.

Both times, the Fed stepped in.

This week, the 30-year swap spread hit a record low last week. Translation? Dealers are under pressure. Liquidity is vanishing.


Chart from Kevin Muir from The Macro Tourist

Here’s the real story:

Pension funds use swaps to hedge rates while keeping cash free for private investments. Banks hedge those swaps by buying Treasuries—but capital requirements limit how...

What's The Beat Report's Reaction Score?

April 13, 2025

What's this "reaction score" we're always talking about?

It's how we statistically measure how significant an earnings reaction was.

We've tried many different methods, but this is the best way. Trust us, we've done the work...

In this post, we want to teach you how to calculate the reaction score on TradingView.

You can save this as a template in TradingView, so you only need to set it up once.

First, add the rate of change indicator with the length set to 1 and base it on the closing price.

Next, right-click on the ROC indicator (we use the default TradingView indicator) and select Add Indicator/Strategy on ROC.

From there, search for the Z-Score script (we use the script from jwammo12), make the length 252 periods, and calculate based on 1 standard deviation.

Here's what it should look like:


Now that we have the template, we can calculate the reaction score for any stock.

Here's how we do it...

In a spreadsheet, we take the z-score from the S&P 500 and subtract the stock...

The Strazza Letter

Two Crypto Non-Tops

April 13, 2025

Sign up for my free note here.

Markets are back in rally mode, and crypto always gives us a good hint as to where things are headed coming into the new week.

Bitcoin, Solana, and friends had a good Saturday session and even repaired some tactical trend damage.

We’ve been discussing various areas of relative strength on our special live streams since last week.

Crypto has been one of them, and the best tokens continue to hold and bounce off key levels.

In fact, I think the potential failed top setups in Ripple and Solana are as good as anything out there right now.

I’m long both for a swing trade and maybe more. We’ll see how things go.

Here is Solana $SOL:


After quickly breaching 120, which has acted as support a good ten times in the past year, SOL just jumped back above this key level and confirmed a bullish...

All Star Charts Gold Rush,
All Star Charts Premium

(Commodities Weekly) This Juice is Worth The Squeeze 🍊

April 11, 2025

Amid historic market volatility, we're looking for uncorrelated trades.

Whether that's Crude Oil, Lumber, or Orange Juice.

Trading commodities doesn't just offer lucrative risk versus reward opportunities, but it also has a very low correlation to other asset classes.

For example, Orange Juice was in a steady uptrend from 2020 until the end of 2024. 

It didn't care about the bear market in 2022. 

And it certainly doesn't care about the bear market in 2025.

This was the best week for the juice since 1998, and we think it has the potential to rally more for the foreseeable future.

This is why we talk about polarity so much 👇...
Macke's Retail Roundup

Video: We Are At The Center Of The Volcano

April 11, 2025

Below is my weekly video for members of Macke's Retail Roundup. 

My universe, the land of the consumer, has taken center stage. The eye of the storm, if you will. The center of the volcano. The hottest part of the mantle. 

And every tariff headline sends the market swinging. Last week, it was down. This week...down, then up, then down. We're stuck in a tariff circle of hell. 

So what does this mean for the portfolio? And what am I doing about it? I broke it all down in this week's video.

Watch the video below.


All Star Charts Premium

International Hall of Famers (04-11-2025)

April 11, 2025

Our International Hall of Famers list is composed of the 100 largest US-listed international stocks, or ADRs.

We've also sprinkled in some of the largest ADRs from countries that did not make the market cap cut. 

These stocks range from some well-known mega-cap multinationals such as Toyota Motor and Royal Dutch Shell to some large-cap global disruptors such as Sea Ltd and Shopify.

It's got all the big names and more–but only those that are based outside the US. You can find all the largest US stocks on our original Hall of Famers list.

The beauty of these scans is really in their simplicity.

We take the largest names each week and then apply technical filters in a way that the strongest stocks with the most momentum rise to the top.

Based on the market environment, we can also flip the scan on its head and filter for weakness.

Let's dive in and take a look at some of the most important stocks from around the world.

Here's this week's list:

...