Larry Thompson Rotation is Here Just Kidding..... Everyone loves a good underdog story. I get it. But the obsession with small caps “finally taking over” every time they outperform for a few days still blows my mind. Two or three times a year, small caps catch a bid. Large caps... December 16, 2025 Search Displaying 6481 - 6504 of 20091 Steve Strazza ARCH Venture Reports a $20 Million PRME Buy From the Desk of Steve Strazza and Alfonso DepablosThe largest insider buy on today’s list comes in a Form 4 filing by Keith Crandell, the co-founder and a managing director of ARCH Venture Partners.ARCH Venture Partners... February 20, 2024 The Hot Corner Insider Buys Sean McLaughlin [Options P2P] Daily Digest 2/20/24 In today's Daily Digest, we'll review: New position in XLU. No adjustments are needed today. An exit in USO.... February 20, 2024 Options Paid to Play Paid To Play Members Only JC Parets Deerfield Reports a $37 Million LRMR Purchase From the Desk of Steve Strazza and Alfonso Depablos The largest insider buy on today’s list comes in a Form 4 filing by Deerfield Asset Management’s James Flynn. The investment firm reported a purchase of $37 million in... February 20, 2024 Stocks Strazza The Hot List Ian Culley Give Platinum a Chance From the Desk of Ian Culley @IanCulleyGold’s beginning to attract some attention.Not because it was shooting higher but because it kept trading while most respectable markets closed in observance of Presidents Day.US... February 20, 2024 ASC Gold Rush Report Precious Metals Video JC Parets Equally-weighted Indexes Back to 2021 Highs And we're back... The new all-time highs in the S&P500 and Nasdaq100 earlier this month have been well documented. What they... February 20, 2024 Stocks Currencies Intermarktet Analysis ASC Patrick Dunuwila David vs. Goliath | Top 10 Report | February 20, 2024 February 20, 2024 The Chart Report: Private Access Top 10 Report Members Only Louis Sykes Morning Crypto Clarity: February 20, 2024 Good morning,Welcome to your daily crypto clarity WHAT YOU NEED TO KNOWEthereum seems to be following through on last week's momentum, with the... February 20, 2024 ASC Crypto Daily JC Parets [Premium] Details For February 2024 Mid-Month Conference Call These are the registration details for our LIVE Mid-month Conference Call for Premium Members of All Star Charts. Our Live Call will be held on Friday February 23rd @ 3PM ET. As always, if you cannot make the call live, the... February 20, 2024 All Star Charts Premium ASC Members Only Steve Strazza Deerfield Reports a $37 Million LRMR Purchase From the Desk of Steve Strazza and Alfonso DepablosThe largest insider buy on today’s list comes in a Form 4 filing by Deerfield Asset Management’s James Flynn.The investment firm reported a purchase of $37 million in Larimar... February 19, 2024 The Hot Corner Insider Buys JC Parets Emergency Meeting Today at Noon February 19, 2024 ASC Louis Sykes Morning Crypto Clarity: February 19, 2024 Good morning,Welcome to your daily crypto clarity WHAT YOU NEED TO KNOWBitcoin's trend is unequivocally higher, with prices lingering around 50,... February 19, 2024 ASC Crypto Daily Louis Sykes Unequivocally Higher In recent weeks, we've pointed to the strength in the flows supporting the crypto market. Nothing has changed, and the trend remains unequivocally higher. February 19, 2024 All Star Charts Crypto Members Only Alfonso De Pablos, CMT Watch the Technical Analysis Bootcamp Here February 18, 2024 All JC Parets The Good, The Bad & The Ugly (2024) As usual, the market is giving investors a set of mixed signals. That's par for the course, isn't it? Let's get into it.... February 18, 2024 Stocks Intermarktet Analysis ASC ASC Chart of the Day Alfonso De Pablos, CMT Saturday Morning Chartoons: Does Apple Warn? This is the weekly post that aggregates all the charts we put together throughout the week and organizes them all into one, easy to flip through deck. February 17, 2024 All Star Charts Premium ASC Chartoons Members Only Alfonso De Pablos, CMT International Hall of Famers (02-16-2024) From the desk of Steve Strazza @Sstrazza Our International Hall of Famers list is composed of the 100 largest US-listed international stocks, or ADRs. We've also sprinkled in some of the largest ADRs from countries that did not... February 16, 2024 All Star Charts Premium Premium Stocks ASC Strazza International Hall Of Famers Members Only Patrick Dunuwila Daily Chart Report 📈 Friday, February 16, 2024 February 16, 2024 The Chart Report Uncategorized Daily Chart Report Front Top Content Featured Stories Ian Culley Buyers Rip into Cotton Futures From the Desk of Ian Culley @IanCulley Naming a newborn is tough. Who is this tiny person? And who will they aspire to be? These are impossible questions to answer. As you can imagine, the wifey and I were... February 16, 2024 All Star Charts Premium Premium Commodities ASC Ian Commodities Weekly Members Only Patrick Dunuwila Chart of the Day - Friday, February 16, 2024 February 16, 2024 The Chart Report $SPX TCR Chart of the Day Sean McLaughlin [Options P2P] Daily Digest 2/16/24 In today's Daily Digest, we'll review: New position in GDXJ. No adjustments needed today. No exits since the last report. ... February 16, 2024 Options Paid to Play Paid To Play Members Only JC Parets Director Bakker Reports a Large RXST Purchase From the Desk of Steve Strazza and Alfonso Depablos The largest insider buy on today’s list comes in a Form 4 filing by RxSight Inc $RXST director Juliet Tammenoms Bakker. Bakker reported a purchase of $406,672 in RXST. February 16, 2024 Stocks Strazza The Hot List Ian Culley Buyers Rip into Cotton Futures From the Desk of Ian Culley @IanCulleyNaming a newborn is tough.Who is this tiny person? And who will they aspire to be?These are impossible questions to answer.As you can imagine, the wifey and I were stumped upon... February 16, 2024 ASC Gold Rush Report Commodities JC Parets Time To Short Apple Volatility continues to pick up. We're seeing bigger prices swings for stocks, in BOTH directions. But of all the things I'm seeing out there, this former darling, and... February 16, 2024 All Star Charts Premium Stocks ASC ASC Chart of the Day Members Only Louis Sykes Morning Crypto Clarity: February 16, 2024 Good morning,Welcome to your daily crypto clarity WHAT YOU NEED TO KNOWBitcoin continues working higher as equity markets failed to follow... February 16, 2024 ASC Crypto Daily Pagination Back 1 … Page 267 Page 268 Page 269 Page 270 Page 271 Page 272 Page 273 Page 274 Page 275 … 838 Next Recent Episodes The Long And Short Of It with Kenny Glick December 16th December 16, 2025 Hosted by Kenny Glick The Open Bar Let's Put Some Money To Work December 16, 2025 Hosted by Steve Strazza Algo Trading With Michael Nauss December 16, 2025 Chart Request Live You Request It, We Break It Down. December 15, 2025 With special guest(s) Sam Gatlin Alfonso De Pablos, CMT The Long And Short Of It with Kenny Glick December 15th December 15, 2025 Hosted by Kenny Glick The King Of Seasonality December 15, 2025 Missed it? No problem!Replays of all our past episodes are always available in the episode archives. View Episode Archives
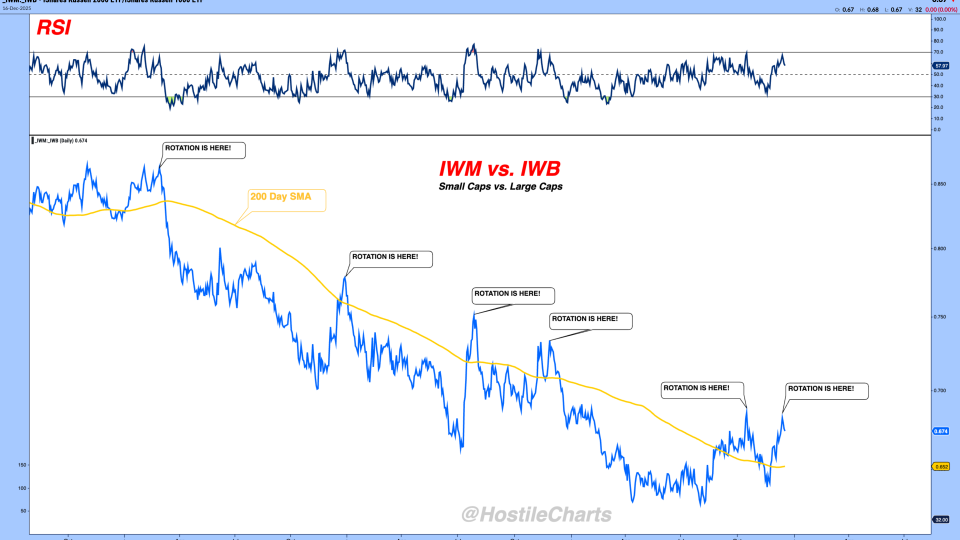
Larry Thompson Rotation is Here Just Kidding..... Everyone loves a good underdog story. I get it. But the obsession with small caps “finally taking over” every time they outperform for a few days still blows my mind. Two or three times a year, small caps catch a bid. Large caps... December 16, 2025
Steve Strazza ARCH Venture Reports a $20 Million PRME Buy From the Desk of Steve Strazza and Alfonso DepablosThe largest insider buy on today’s list comes in a Form 4 filing by Keith Crandell, the co-founder and a managing director of ARCH Venture Partners.ARCH Venture Partners... February 20, 2024 The Hot Corner Insider Buys
Sean McLaughlin [Options P2P] Daily Digest 2/20/24 In today's Daily Digest, we'll review: New position in XLU. No adjustments are needed today. An exit in USO.... February 20, 2024 Options Paid to Play Paid To Play Members Only
JC Parets Deerfield Reports a $37 Million LRMR Purchase From the Desk of Steve Strazza and Alfonso Depablos The largest insider buy on today’s list comes in a Form 4 filing by Deerfield Asset Management’s James Flynn. The investment firm reported a purchase of $37 million in... February 20, 2024 Stocks Strazza The Hot List
Ian Culley Give Platinum a Chance From the Desk of Ian Culley @IanCulleyGold’s beginning to attract some attention.Not because it was shooting higher but because it kept trading while most respectable markets closed in observance of Presidents Day.US... February 20, 2024 ASC Gold Rush Report Precious Metals Video
JC Parets Equally-weighted Indexes Back to 2021 Highs And we're back... The new all-time highs in the S&P500 and Nasdaq100 earlier this month have been well documented. What they... February 20, 2024 Stocks Currencies Intermarktet Analysis ASC
Patrick Dunuwila David vs. Goliath | Top 10 Report | February 20, 2024 February 20, 2024 The Chart Report: Private Access Top 10 Report Members Only
Louis Sykes Morning Crypto Clarity: February 20, 2024 Good morning,Welcome to your daily crypto clarity WHAT YOU NEED TO KNOWEthereum seems to be following through on last week's momentum, with the... February 20, 2024 ASC Crypto Daily
JC Parets [Premium] Details For February 2024 Mid-Month Conference Call These are the registration details for our LIVE Mid-month Conference Call for Premium Members of All Star Charts. Our Live Call will be held on Friday February 23rd @ 3PM ET. As always, if you cannot make the call live, the... February 20, 2024 All Star Charts Premium ASC Members Only
Steve Strazza Deerfield Reports a $37 Million LRMR Purchase From the Desk of Steve Strazza and Alfonso DepablosThe largest insider buy on today’s list comes in a Form 4 filing by Deerfield Asset Management’s James Flynn.The investment firm reported a purchase of $37 million in Larimar... February 19, 2024 The Hot Corner Insider Buys
Louis Sykes Morning Crypto Clarity: February 19, 2024 Good morning,Welcome to your daily crypto clarity WHAT YOU NEED TO KNOWBitcoin's trend is unequivocally higher, with prices lingering around 50,... February 19, 2024 ASC Crypto Daily
Louis Sykes Unequivocally Higher In recent weeks, we've pointed to the strength in the flows supporting the crypto market. Nothing has changed, and the trend remains unequivocally higher. February 19, 2024 All Star Charts Crypto Members Only
JC Parets The Good, The Bad & The Ugly (2024) As usual, the market is giving investors a set of mixed signals. That's par for the course, isn't it? Let's get into it.... February 18, 2024 Stocks Intermarktet Analysis ASC ASC Chart of the Day
Alfonso De Pablos, CMT Saturday Morning Chartoons: Does Apple Warn? This is the weekly post that aggregates all the charts we put together throughout the week and organizes them all into one, easy to flip through deck. February 17, 2024 All Star Charts Premium ASC Chartoons Members Only
Alfonso De Pablos, CMT International Hall of Famers (02-16-2024) From the desk of Steve Strazza @Sstrazza Our International Hall of Famers list is composed of the 100 largest US-listed international stocks, or ADRs. We've also sprinkled in some of the largest ADRs from countries that did not... February 16, 2024 All Star Charts Premium Premium Stocks ASC Strazza International Hall Of Famers Members Only
Patrick Dunuwila Daily Chart Report 📈 Friday, February 16, 2024 February 16, 2024 The Chart Report Uncategorized Daily Chart Report Front Top Content Featured Stories
Ian Culley Buyers Rip into Cotton Futures From the Desk of Ian Culley @IanCulley Naming a newborn is tough. Who is this tiny person? And who will they aspire to be? These are impossible questions to answer. As you can imagine, the wifey and I were... February 16, 2024 All Star Charts Premium Premium Commodities ASC Ian Commodities Weekly Members Only
Patrick Dunuwila Chart of the Day - Friday, February 16, 2024 February 16, 2024 The Chart Report $SPX TCR Chart of the Day
Sean McLaughlin [Options P2P] Daily Digest 2/16/24 In today's Daily Digest, we'll review: New position in GDXJ. No adjustments needed today. No exits since the last report. ... February 16, 2024 Options Paid to Play Paid To Play Members Only
JC Parets Director Bakker Reports a Large RXST Purchase From the Desk of Steve Strazza and Alfonso Depablos The largest insider buy on today’s list comes in a Form 4 filing by RxSight Inc $RXST director Juliet Tammenoms Bakker. Bakker reported a purchase of $406,672 in RXST. February 16, 2024 Stocks Strazza The Hot List
Ian Culley Buyers Rip into Cotton Futures From the Desk of Ian Culley @IanCulleyNaming a newborn is tough.Who is this tiny person? And who will they aspire to be?These are impossible questions to answer.As you can imagine, the wifey and I were stumped upon... February 16, 2024 ASC Gold Rush Report Commodities
JC Parets Time To Short Apple Volatility continues to pick up. We're seeing bigger prices swings for stocks, in BOTH directions. But of all the things I'm seeing out there, this former darling, and... February 16, 2024 All Star Charts Premium Stocks ASC ASC Chart of the Day Members Only
Louis Sykes Morning Crypto Clarity: February 16, 2024 Good morning,Welcome to your daily crypto clarity WHAT YOU NEED TO KNOWBitcoin continues working higher as equity markets failed to follow... February 16, 2024 ASC Crypto Daily
Chart Request Live You Request It, We Break It Down. December 15, 2025 With special guest(s) Sam Gatlin Alfonso De Pablos, CMT