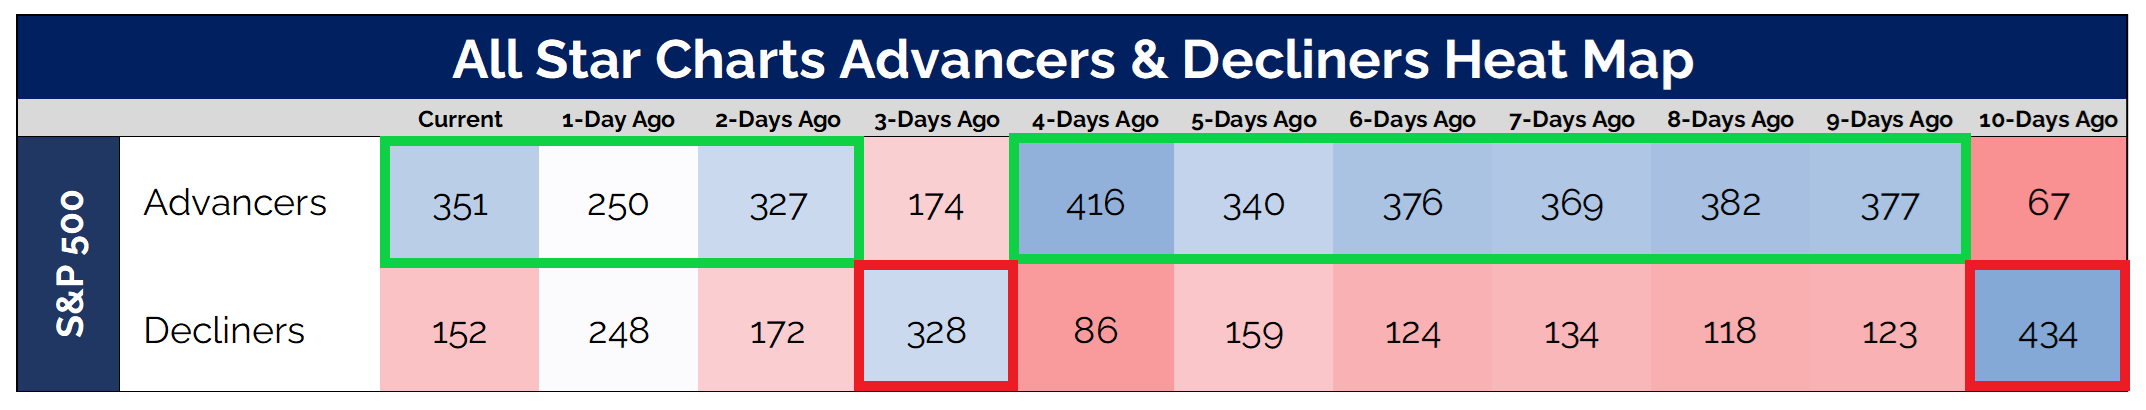
On Monday, the S&P 500 closed down by 1.46%. However, if you look deeper, you will actually see that 351 (69%) S&P 500 stocks advanced while only 152 declined for the day.
Here's the data:
(right-click and open image in new tab to zoom in)
Let's break down what the table shows:
The first row represents the advancing stocks of the S&P 500, while the second row shows the declining stocks. Each column corresponds to a trading day, starting with the current day on the left and moving to the right through the past ten days.
The Takeaway: The breadth of the S&P 500 has improved over the past two weeks. In 9 of the last 11 trading days, more stocks have advanced than declined. Even on days when the index showed weakness, breadth continued to improve.
But let's take a closer look at yesterday's scenario: When the S&P 500 index drops by over 1% and more than half of the stocks (over 50%) advance.
I found that this scenario hasn't happened too often. In fact, this has only happened twice in the past two decades. One instance occurred yesterday, and the other was on July 17, 2024 and after the July 2024 instance, we saw the S&P 500 index decline an additional 7.8% over the following 12 trading days.
So, is this pattern going to play out again? Or is it different this time?
If you find my content valuable, I would greatly appreciate it if you could share it with your friends, family, and colleagues. Your help in spreading the word is invaluable in supporting our work. Thank you to all of you who share!