The NYSE FANG+ Index, made up of 10 large-cap growth stocks, just closed at new all-time highs.
Here’s the chart:
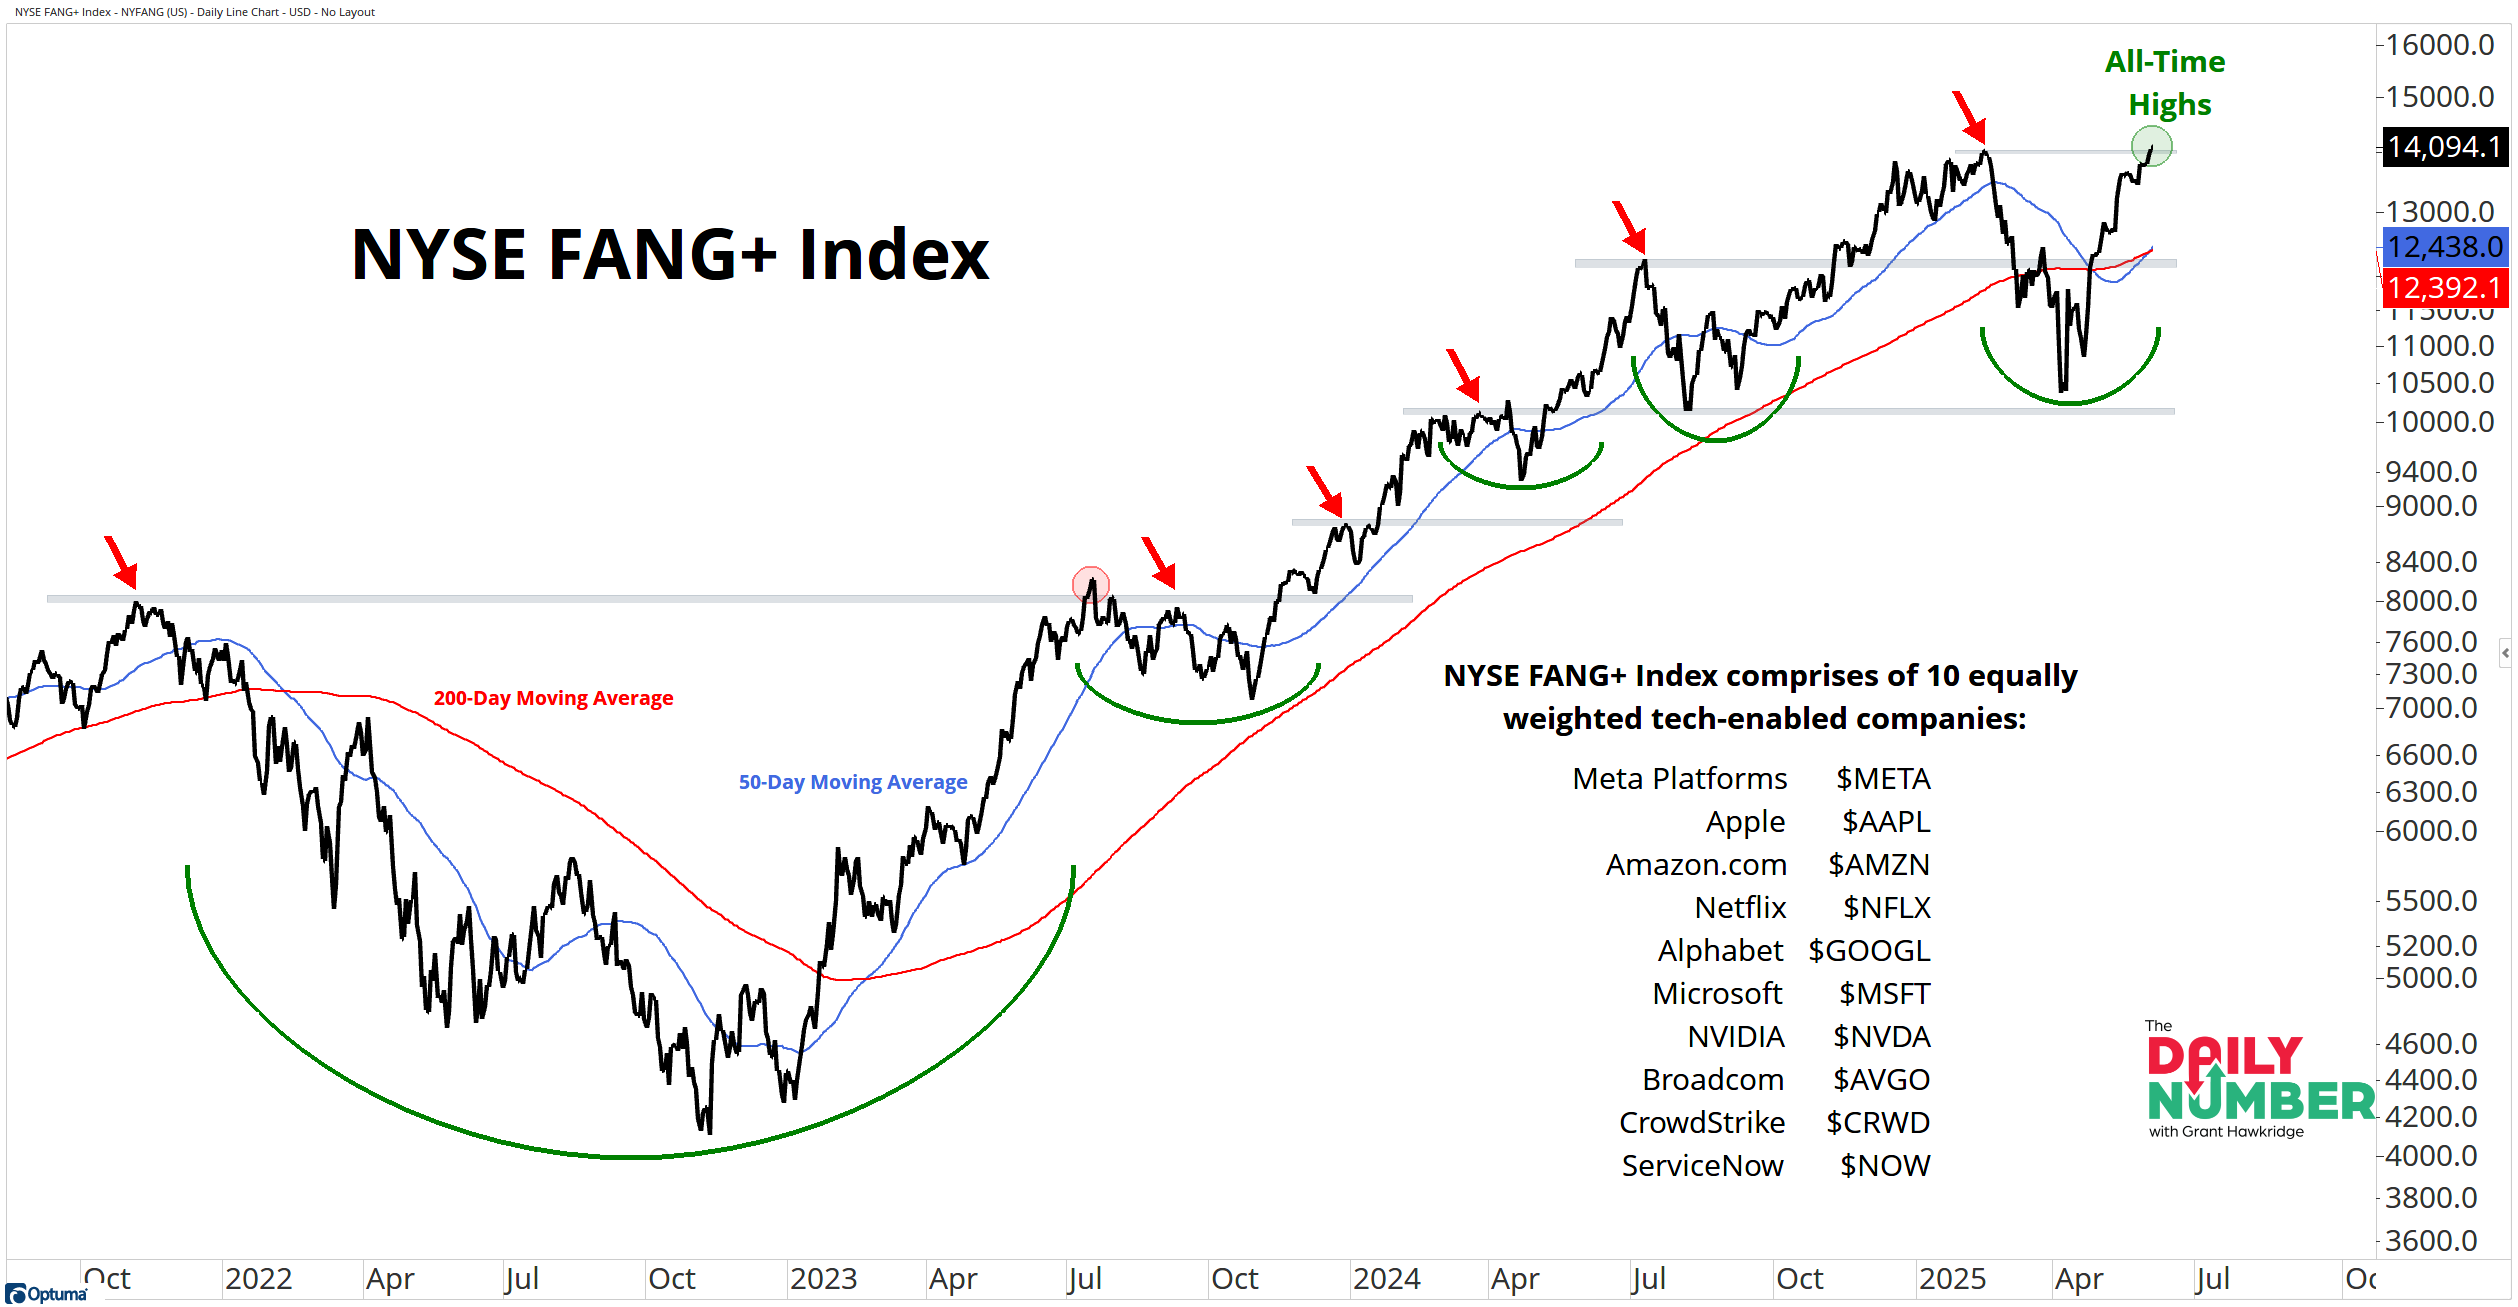
Let's break down what the chart shows:
The black line shows the price of the NYSE FANG+ Index.
The redline is the 200-day moving average of the index.
The blue line is the 50-day moving average of the index.
The Takeaway: The NYSE FANG+ Index tracks some of the biggest and most important tech names in the market.
Think Microsoft, Apple, Amazon, and NVIDIA.
These are the companies that tend to lead when the market is strong.
Since bottoming in November 2022 during the cost-of-living crisis, this index has been marching higher in a polite, stair-stepping fashion.
Breakout, pause, repeat.
Now they’ve broken out again — this time to record highs.
That’s not all.
The 50-day moving average just crossed above the 200-day moving average. That’s a golden cross. It’s a bullish signal. It tells us the trend is strengthening.
And strength from these names is exactly what the broader market needs.
You want your best players on the field.
And these are the best players.
When they lead, the rest of the market tends to follow.
Look at Netflix and Broadcom — both just hit all-time highs.
Microsoft is only 0.8% below its own all-time high.
If you want the overall market to move higher, you want to see these large-cap growth names continue to push higher.
Grant Hawkridge | Chief Aussie Operator, All Star Charts
Need a full trading toolkit that actually helps you make moves? All Star Charts Premium gives you daily trade ideas, proprietary scans, and access to our entire analyst team. If you're serious about leveling up your strategy,start here.
If you find my content valuable, I would greatly appreciate it if you could share it with your friends, family, and colleagues. Your help in spreading the word is invaluable in supporting our work. Thank you to all of you who share!