June 26 ranks as the fifth-worst trading day of the year for the S&P 500 since 1950. And this year, it lands on this coming Thursday.
Here’s the table:
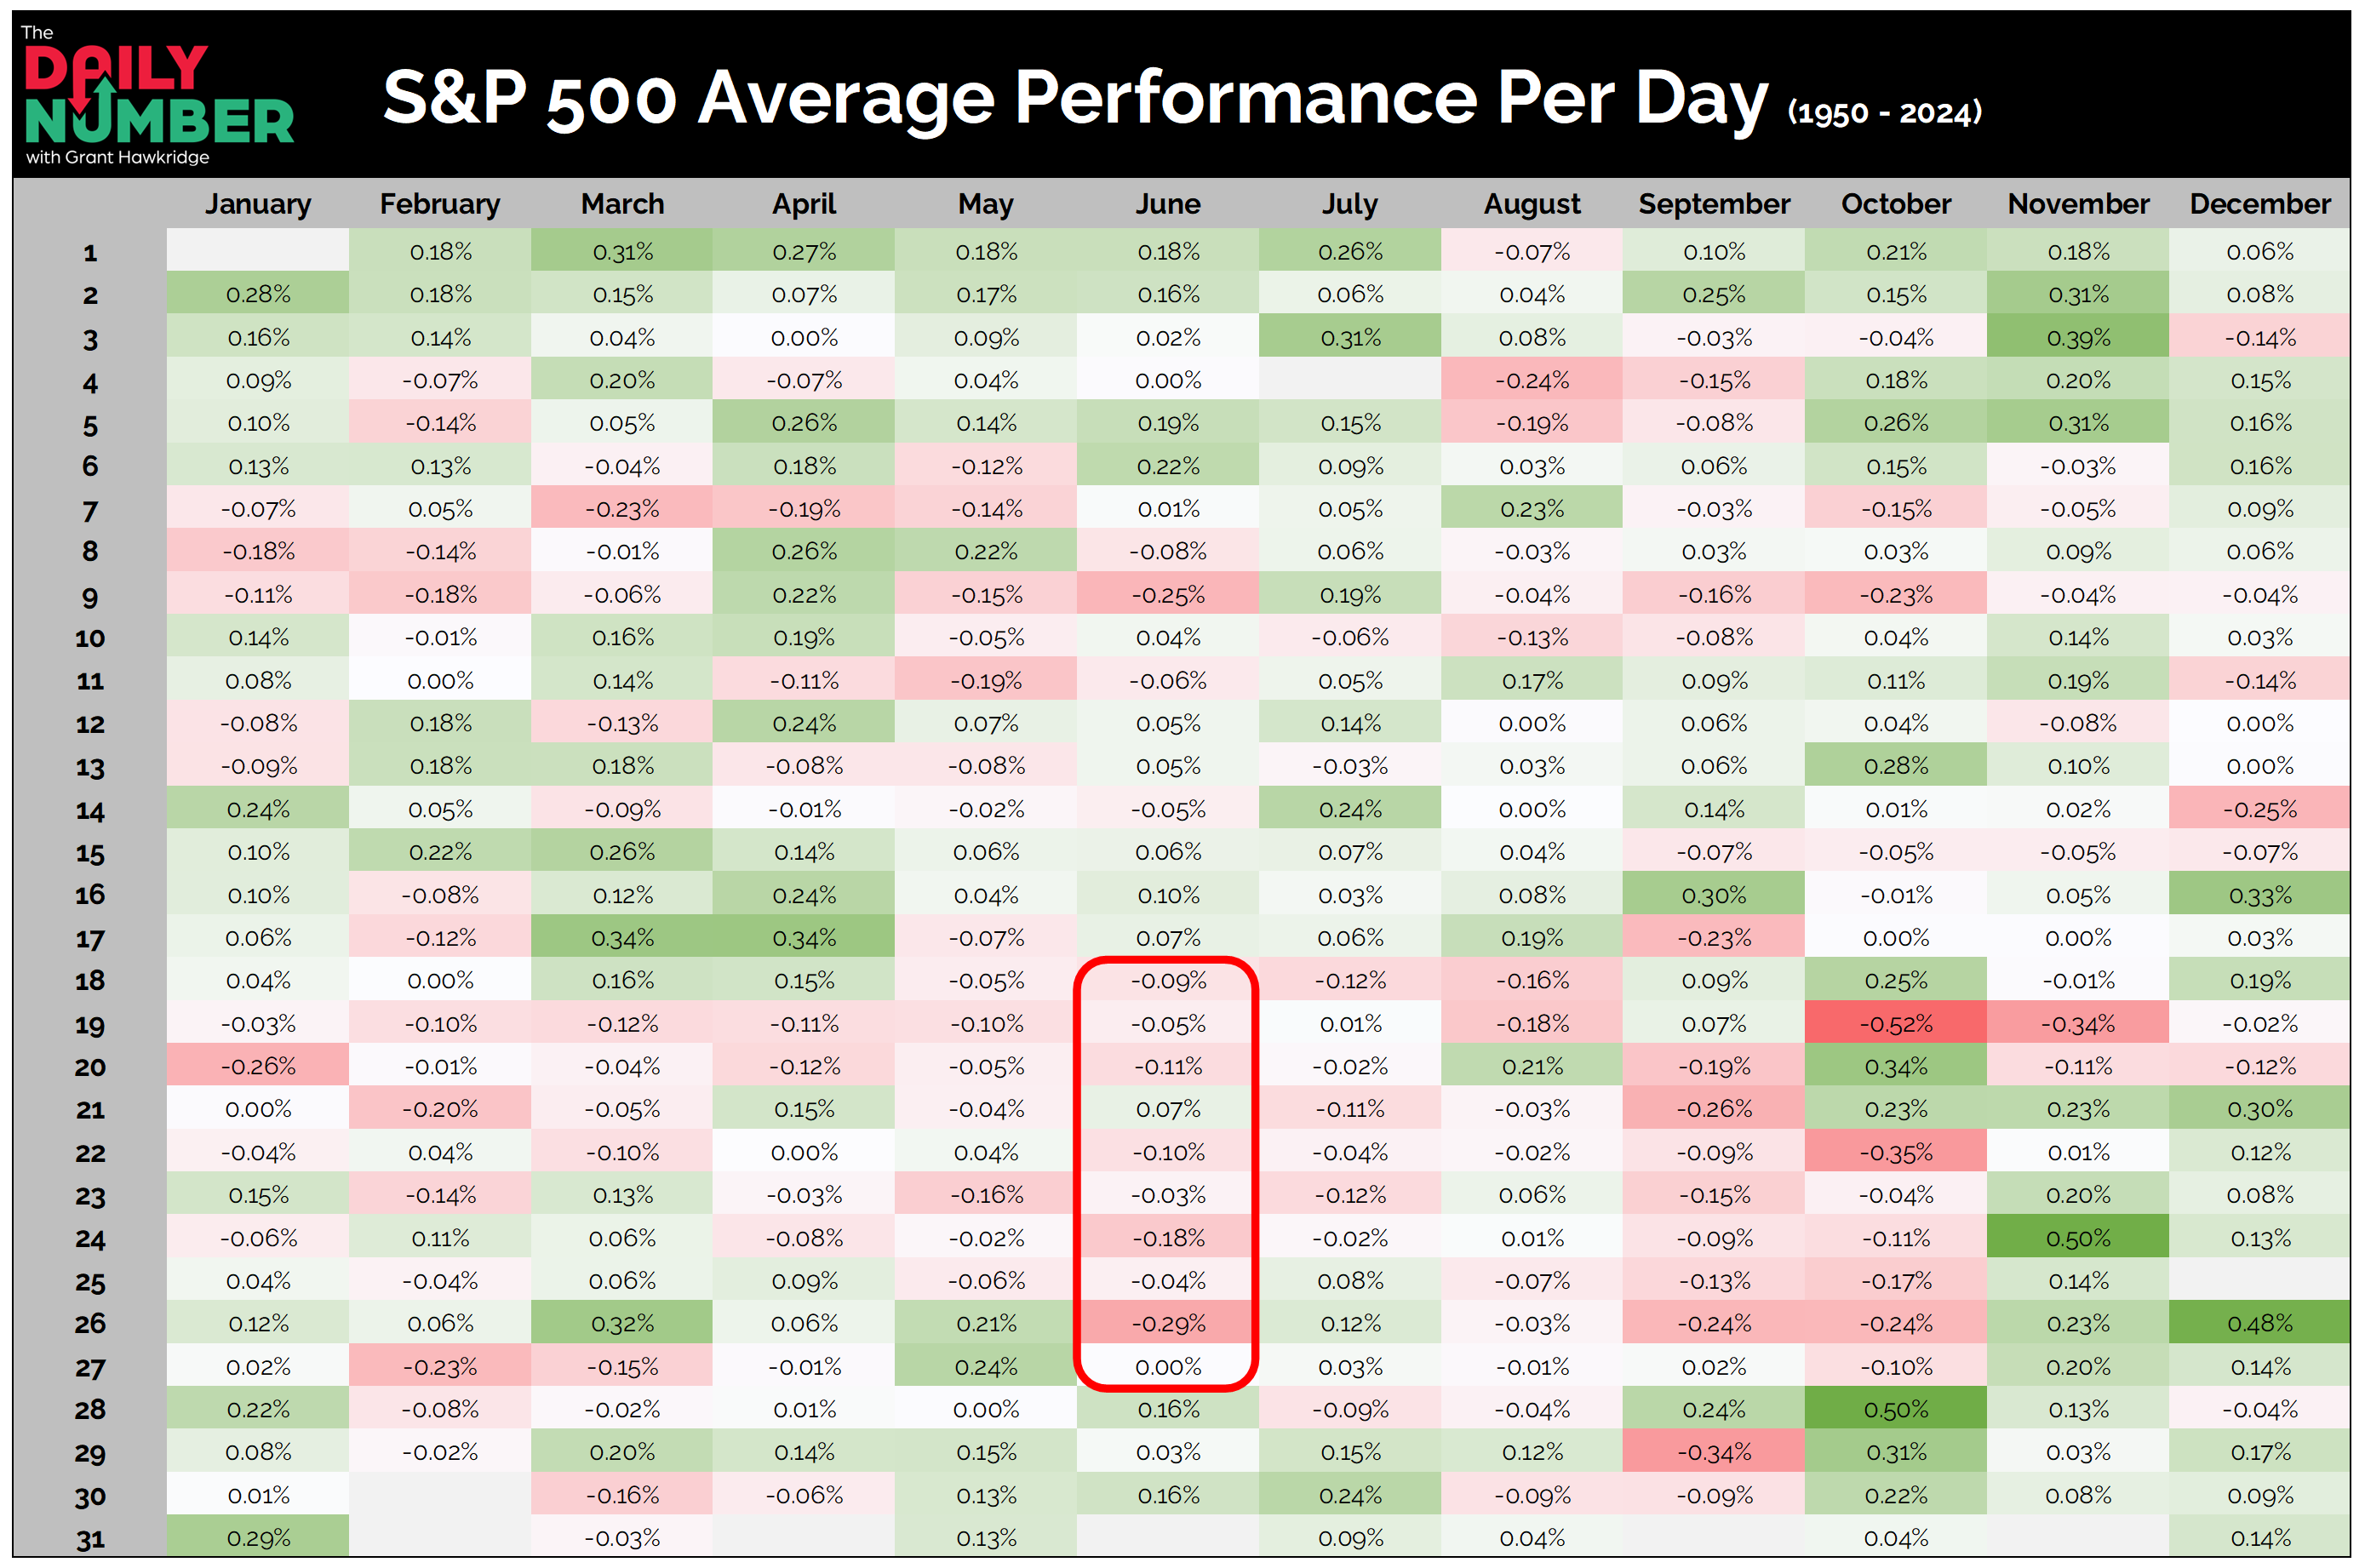
Let's break down what the table shows:
This table tracks the S&P 500’s average daily return for each day of the year from 1950 to 2024. Each row reflects how the index typically performs on that calendar date, averaged across more than 70 years.
The Takeaway: June 26 stands out with an average return of –0.29%, placing it firmly among the market’s biggest seasonal potholes.
But it’s not just one bad day.
It’s part of a broader stretch of trouble. From June 18 to June 27, nearly every day has posted a negative average return.
It’s one of the most consistently weak windows on the calendar.
It’s a rare cluster of red that’s held up across decades.
And this year, the pattern may already be in motion. From June 18 to 20, the S&P 500 has already slipped by 0.25%, hinting that seasonal headwinds are starting to emerge.
Seasonality doesn’t move markets on its own. But when it aligns with a trend that’s already been losing momentum, the signal gets harder to ignore.
Momentum is slipping.
Seasonality is no friend here.
And Thursday brings the biggest statistical risk of the month.
Grant Hawkridge | Chief Aussie Operator, All Star Charts
From breakout setups to sector rotation, we cover what matters. With Premium, you get curated watchlists like the “Hall of Famers” and “Freshly Squeezed” — plus our take on what to do with them. Stay on top of the action and trade with confidence.
If you find my content valuable, I would greatly appreciate it if you could share it with your friends, family, and colleagues. Your help in spreading the word is invaluable in supporting our work. Thank you to all of you who share!