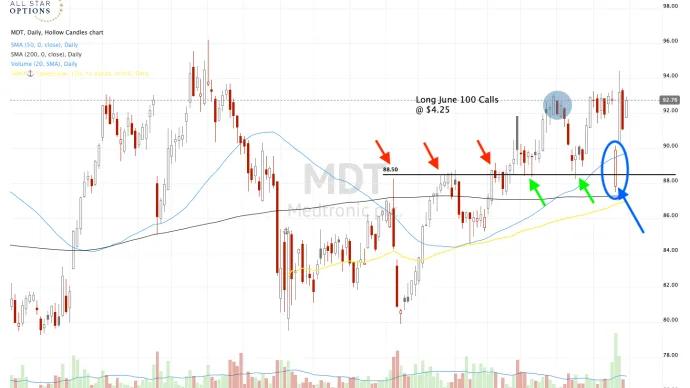
This trade is still open, and it may very well end up a loser. In fact, the odds say it probably will. More than 70% of my long call trades lose money. That’s just math.
Below is my weekly video for members of Macke's Retail Roundup.
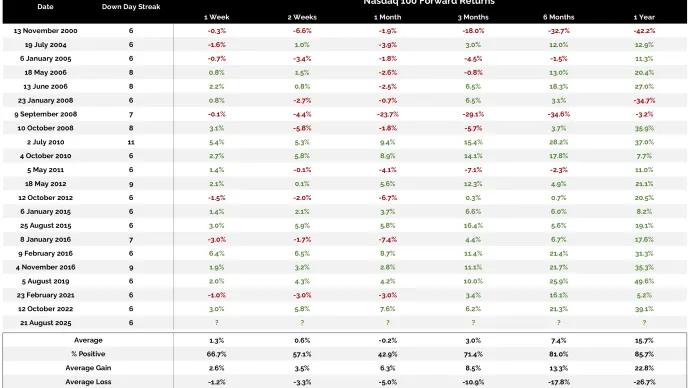
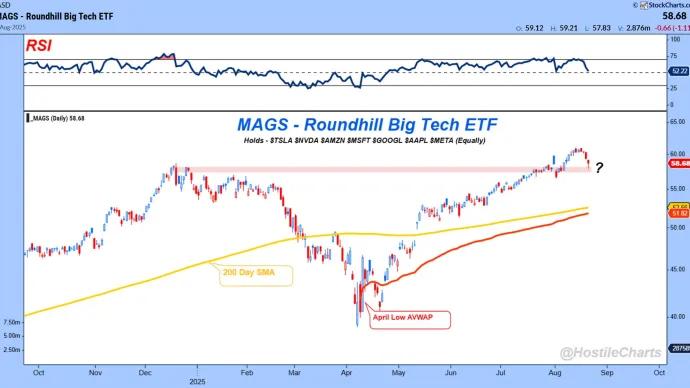
Jackson Hole comments send retail flying! In the attached video, I welcome new members, set up possible trades for the next few weeks and hint at positions I'm...
Today's trade is in a stock that had a beautiful breakout BEFORE the Powell news that ripped the broader markets higher.And it's in a company that many of use just about every day to spend money on our daily expenses. Maybe we should get rewarded for...
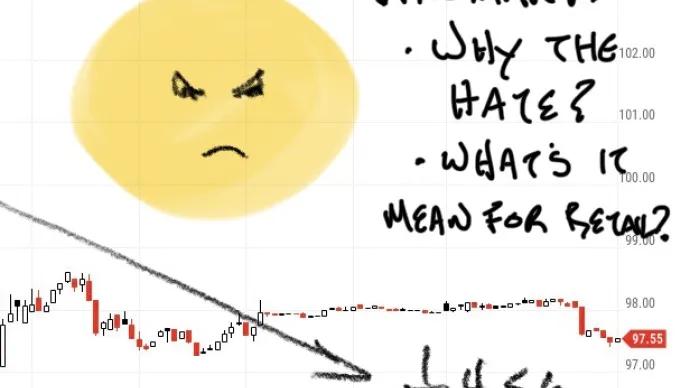
What Walmart told us about Inflation and what it mean for Stocks
Walmart Sent a Chill Through Retail Yesterday
The world's biggest retailer cranked out a decent quarter yesterday morning and was met with Bronx tears by Wall Street and the rest of the investing world. WMT...
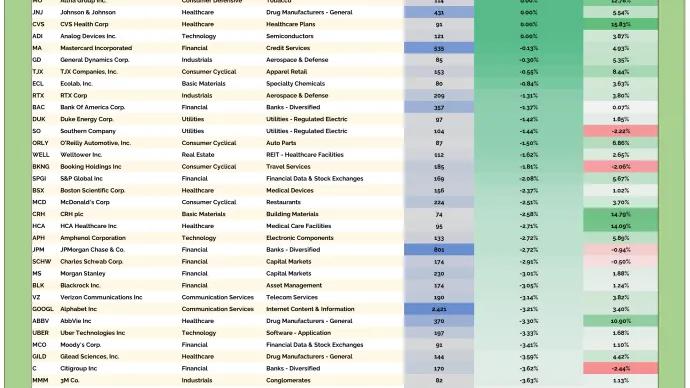
Every day, we sift through the filings to spot where the real conviction lies – cutting through the noise to highlight the most meaningful insider moves.