Every day, we sift through the filings to spot where the real conviction lies – cutting through the noise to highlight the most meaningful insider moves.
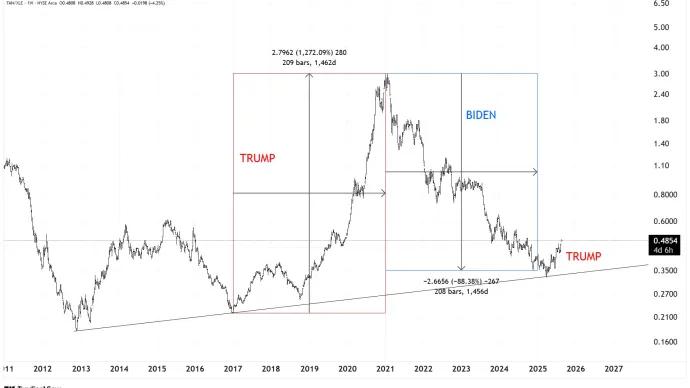
International markets have offered investors no shortage of opportunities this year — the first of many to come.Throughout the year, we’ve spotlighted individual countries. But today, we’re zooming out to...
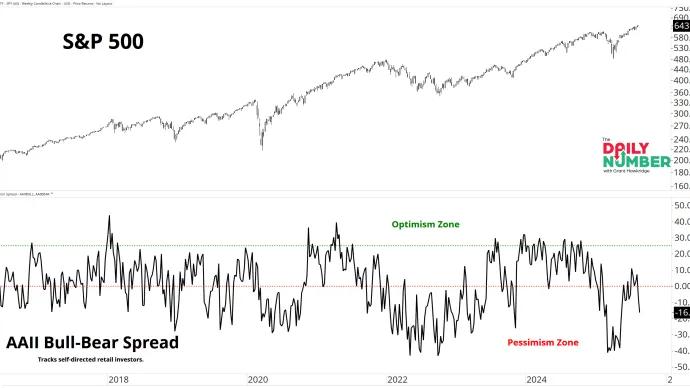
We’re in that stretch of the year when seasonality makes holding long positions an act of extreme patience. The last couple weeks of summer often bring thinner volumes, and with fewer participants, it can feel like watching paint...
Every day, we sift through the filings to spot where the real conviction lies – cutting through the noise to highlight the most meaningful insider moves.
Every weekend, I dig into our insider activity tracker looking for the biggest conviction buys — and this week, the tape is packed with heavyweight moves from executives and funds alike.