Once a week, I get together with Sean McLaughlin from All Star Options, and we're going to find an options trade to hunt for a new options trade for my Portfolio+ members. The goal is simple: utilize my expertise on the consumer and Sean's...
Every day, we sift through the filings to spot where the real conviction lies – cutting through the noise to highlight the most meaningful insider moves.
Back on January 22nd, when FedEx was trading below $310 per share, I entered a bullish call calendar spread in $FDX options. Shorted the March 350 calls and purchased an...
Precious metals have been on an absolute tear for nearly two years now, and there’s no point pretending otherwise. Since Gold entered a brand-new secular uptrend on March 4, 2024, this market has rewarded those who stayed with the trend and...
Every day, we sift through the filings to spot where the real conviction lies – cutting through the noise to highlight the most meaningful insider moves.
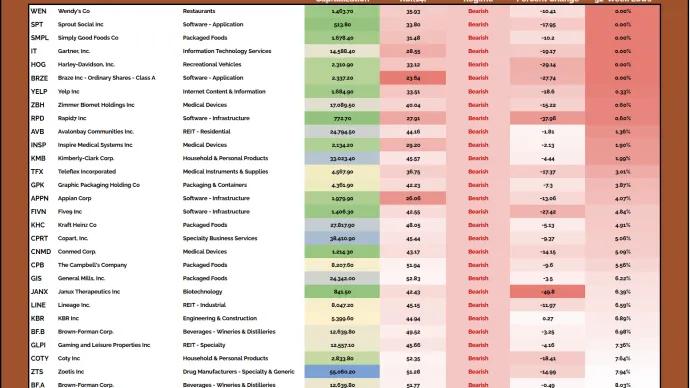
📌 International Paper $IP — Director Christopher...