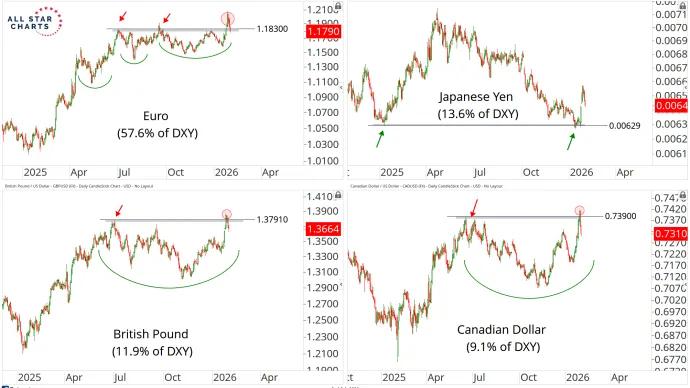
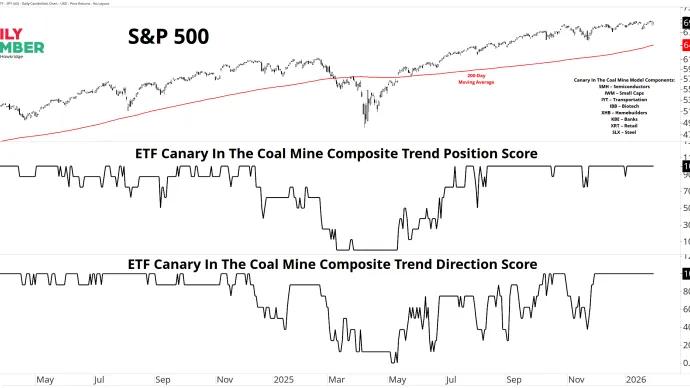
When a structural trend reaches a turning point… expect volatility. We’re a month into 2026, and the US Dollar is already stirring the pot– making big moves and flirting with the completion of a major top.
Once a week, I get together with Sean McLaughlin from All Star Options, and we're going to find an options trade to hunt for a new options trade for my Portfolio+ members. The goal is simple: utilize my expertise on the consumer and Sean's...
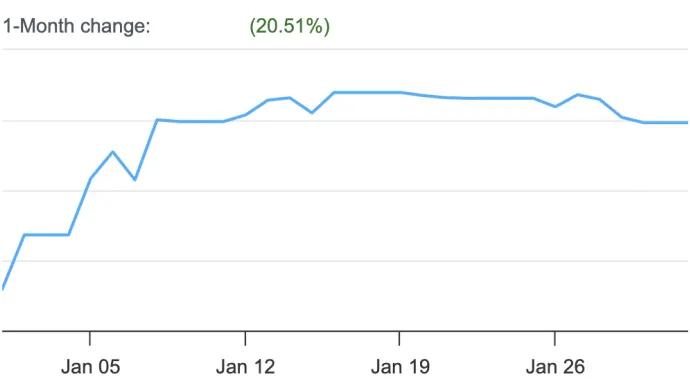
The metals market just reminded everyone why commodities are not for the faint of heart.Friday was ugly. Brutal, even. Gold futures closed the session down more than 11%. Palladium futures were off over 15%. Platinum futures collapsed...
The energy sector is showing signs of leadership, and I'm feeling underexposed to the space. So today, I'm attempting to move in this direction with a play on a natural gas pipeline company that appears on the verge of a breakout.
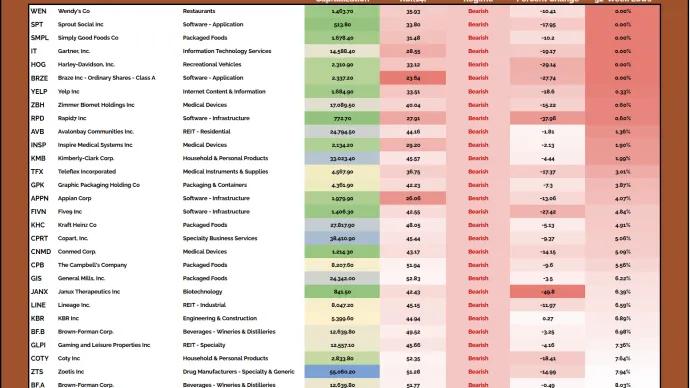
Every day, we sift through the filings to spot where the real conviction lies – cutting through the noise to highlight the most meaningful insider moves.