📊 Daily ETF Overview We can’t understate the significance of micro-caps $IWC—the smallest and most speculative stocks in the market—breaking out to all-time highs for the first time since 2021. As we look toward the second half of...
Last week in our global column, we highlighted Peru’s ETF, $EPU. The breakout has been so compelling that we’re bringing it back to the forefront again this week.
EPU is trading at fresh all-time highs, supported by...
Every trader starts in the same place.Trying to be clever.Trying to buy bottoms.Trying to short tops.It feels logical. It feels sophisticated. You convince yourself you’re early, that you’re seeing something others don’t. And sometimes, you even get...
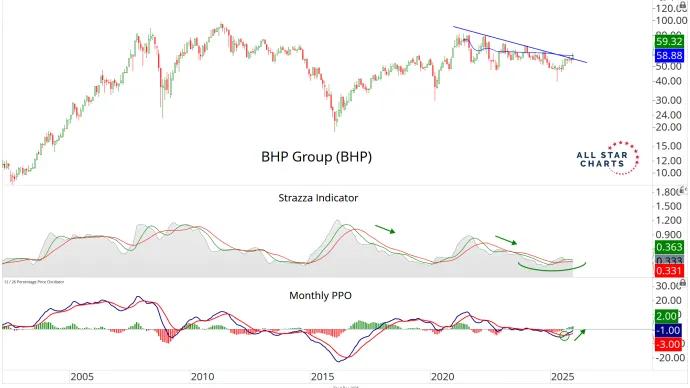
Today's trade is in a stock that is completing a multi-year base and relative strength is rising to confirm the trend.I'm going to position in an attempt to capture the meat of a possible next leg higher.
Every day, we sift through the filings to spot where the real conviction lies – cutting through the noise to highlight the most meaningful insider moves.
📌Kodiak Sciences $KOD — The Baker Bros. revealed...