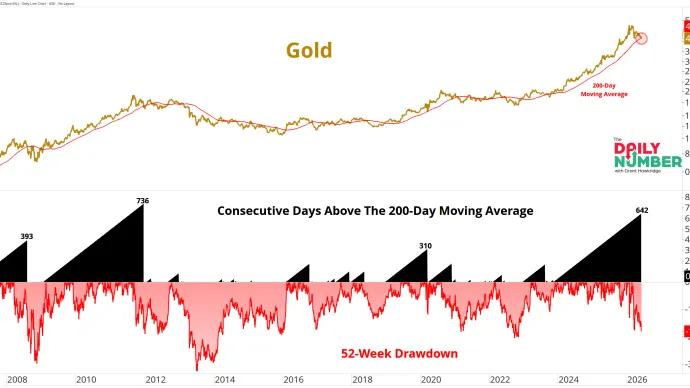
Gold finally lost its footing. After spending 642 consecutive trading days above its 200-day moving average, the metal has now broken below that key trend...
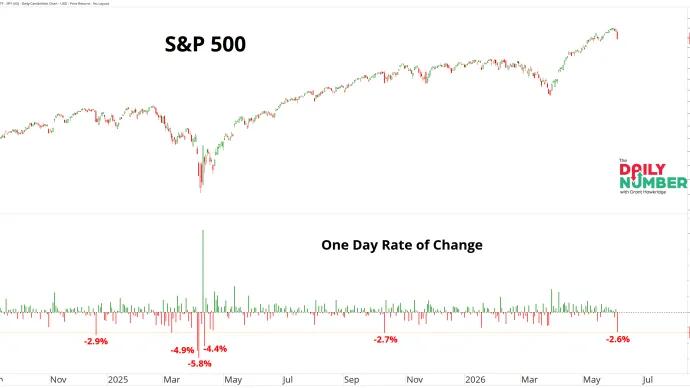
The market's biggest winners finally got hit. Technology stocks led the selloff as the S&P 500 fell 2.6% on Friday, its first decline of 2% or more in 93 trading days.
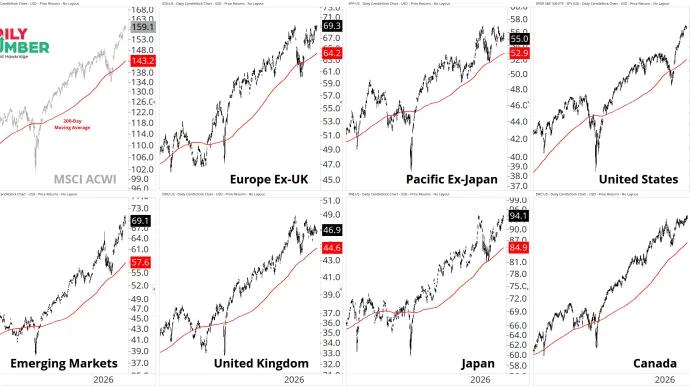
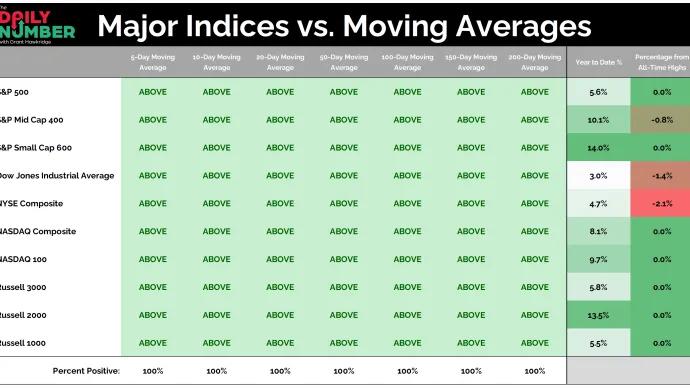
The world's major stock markets are moving in lockstep. Every region I track remains above a rising 200-day moving average, with most sitting near all-time highs and none showing signs of long-term trend...
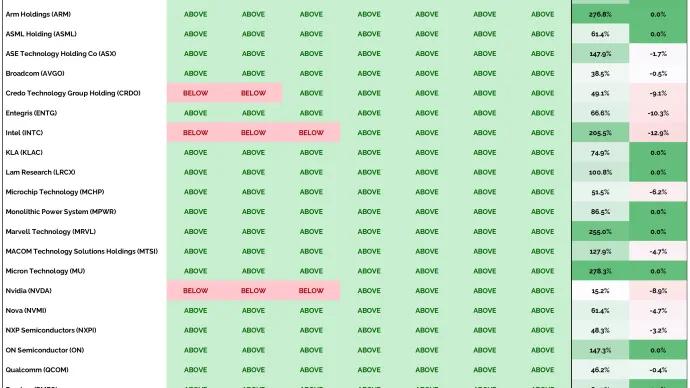
Semiconductors have become the market's undisputed leadership group. The Semiconductor ETF (SOXX) has soared 104.4% so far in 2026, more than doubling while much of Wall Street...
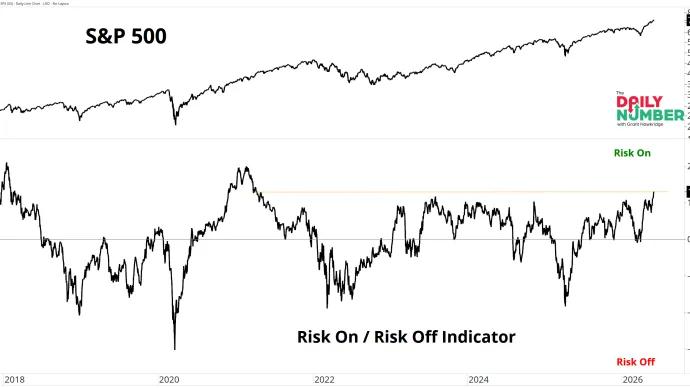
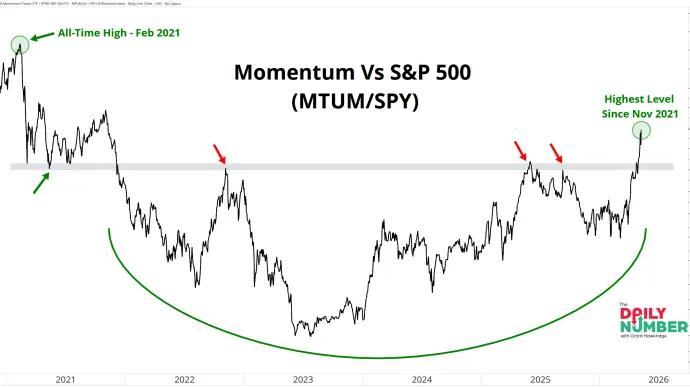
The market's appetite for risk just reached its strongest level in roughly five years. The Risk On / Risk Off Indicator climbed to 1.3, breaking above a ceiling that had capped advances...
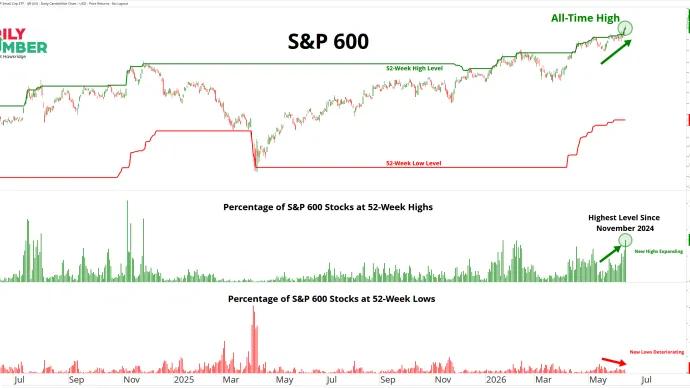
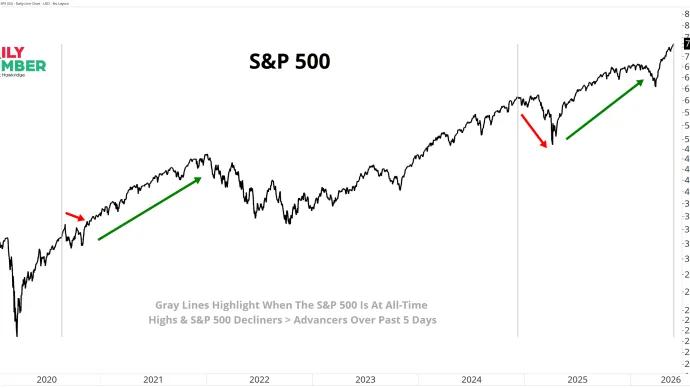
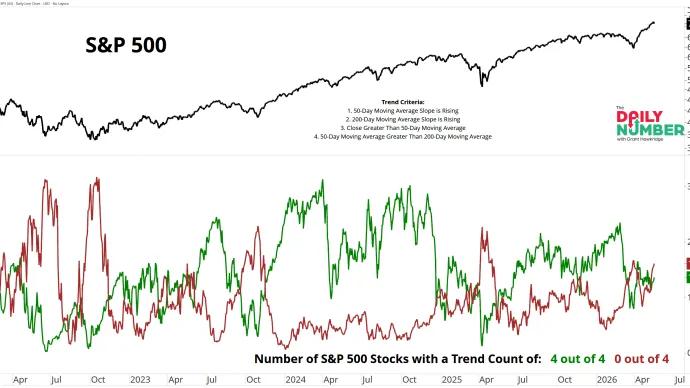
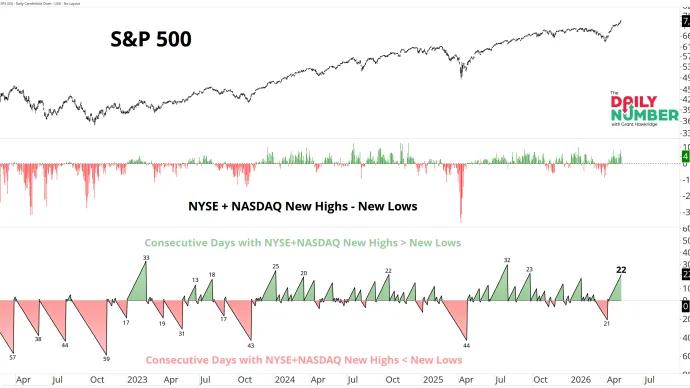
The S&P 500 just climbed to a fresh all-time high even as more stocks fell than rose for five straight trading days. That's a rare combination that has only shown up a handful of times...
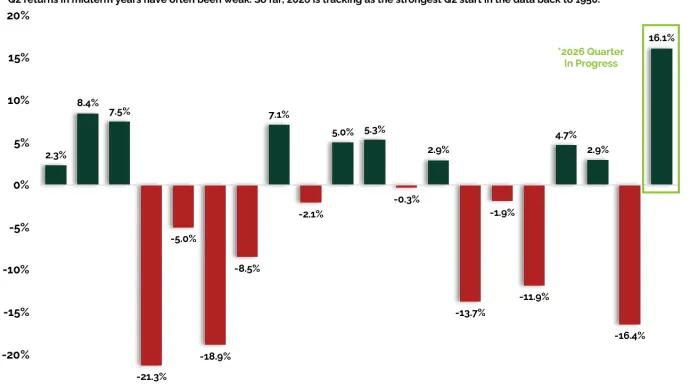
The market just delivered the strongest start to a midterm-year Q2 in the data going back to 1950. That's happening during a period that is supposed to be one of the toughest stretches of the entire...
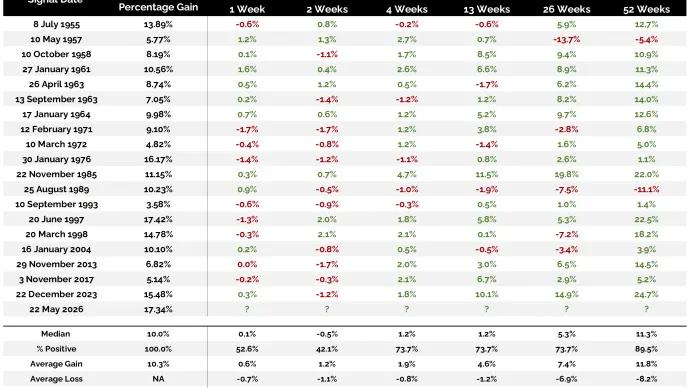
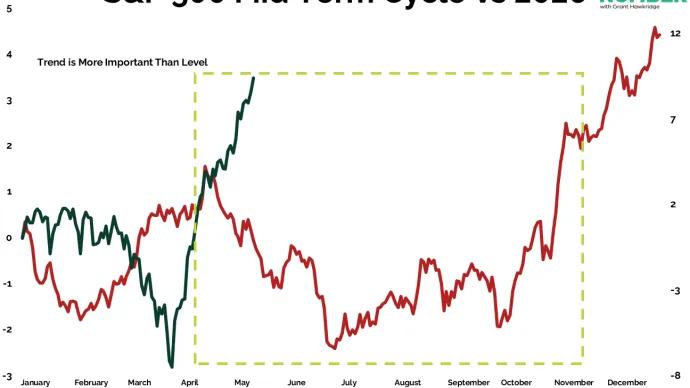
Seasonal weakness is here. The breadth regime has ended. And yet the S&P 500 just delivered one of the strongest momentum surges of the past 70 years. The index gained 17.3% across...
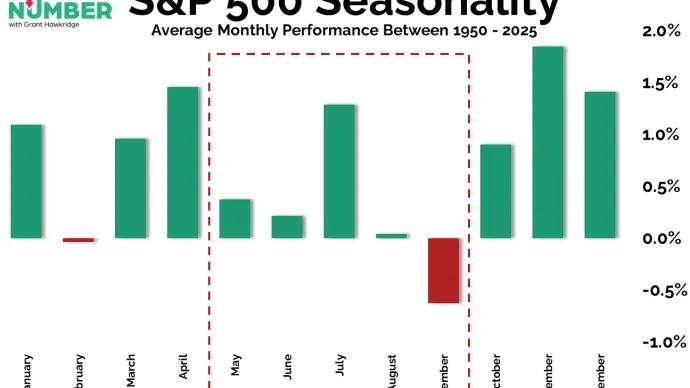
This is usually the point in the mid-term cycle when it starts becoming much more challenging for investors. Historically, May has often marked the beginning of one of the weakest and most volatile...
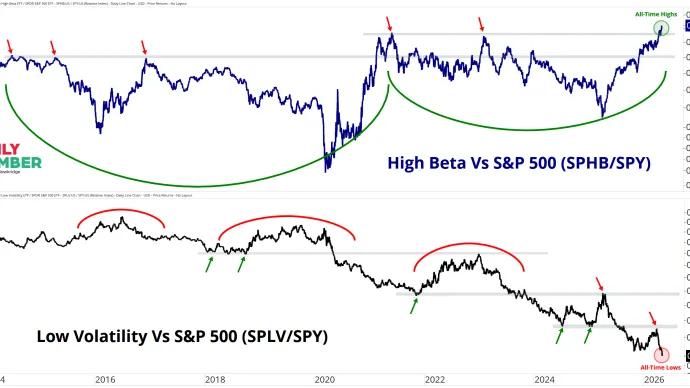
Two extremes just hit at the same time: the riskiest stocks on Wall Street just hit all-time highs relative to the S&P 500, while the safest stocks just hit all-time lows.