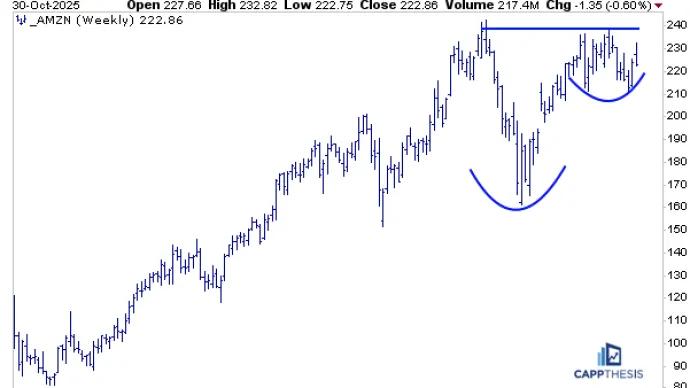
In the attached video I'm talking about Amazon's huge win, why Starbucks is still dead money and Chipotle is hopeless. I also take a look at next week as I look to prune some dead weight from...
After the biggest cattle boom in 50 years, grains and feed are finally fighting back.
Agriculture has been a tale of two markets recently.
On the one hand, grains - the backbone of the post-pandemic commodity boom - have been in a deep bear market since 2022, giving back much of their post-COVID gains.
I'm not going to mince words. I have a feeling the market is overlooking the potential for a pop in a smaller semiconductor stock that will be reporting earnings next week.
This earnings report could wake up the animal spirits in this...
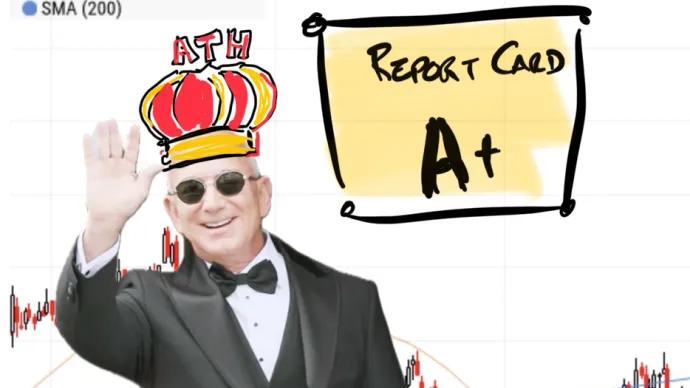
Shares of Amazon are hitting all-time highs in the pre-market after AWS growth exceeded 20% for the first time since 2022. This has alleviated concerns that the company was losing market share in AI and the cloud, despite years of massive...
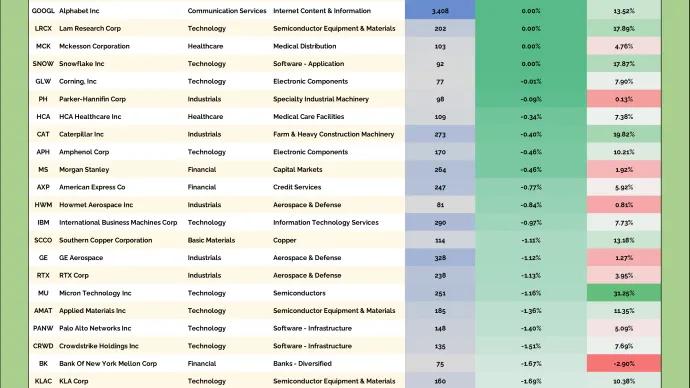
Every day, we sift through the filings to spot where the real conviction lies – cutting through the noise to highlight the most meaningful insider moves.
If you’ve ridden the New York City subway recently, you’ve seen the bright orange Moomoo bull staring back at you — or maybe it caught your eye at Citi Field.
Either way, Moomoo has become a recognizable brand in the U....
Ever held options in a stock that got acquired and wondered what the hell happens next?
We're living through exactly that scenario right now with Sandstorm Gold $SAND, which was acquired by Royal Gold $RGLD. We were long January $12 calls when...